
|
Fig. 3
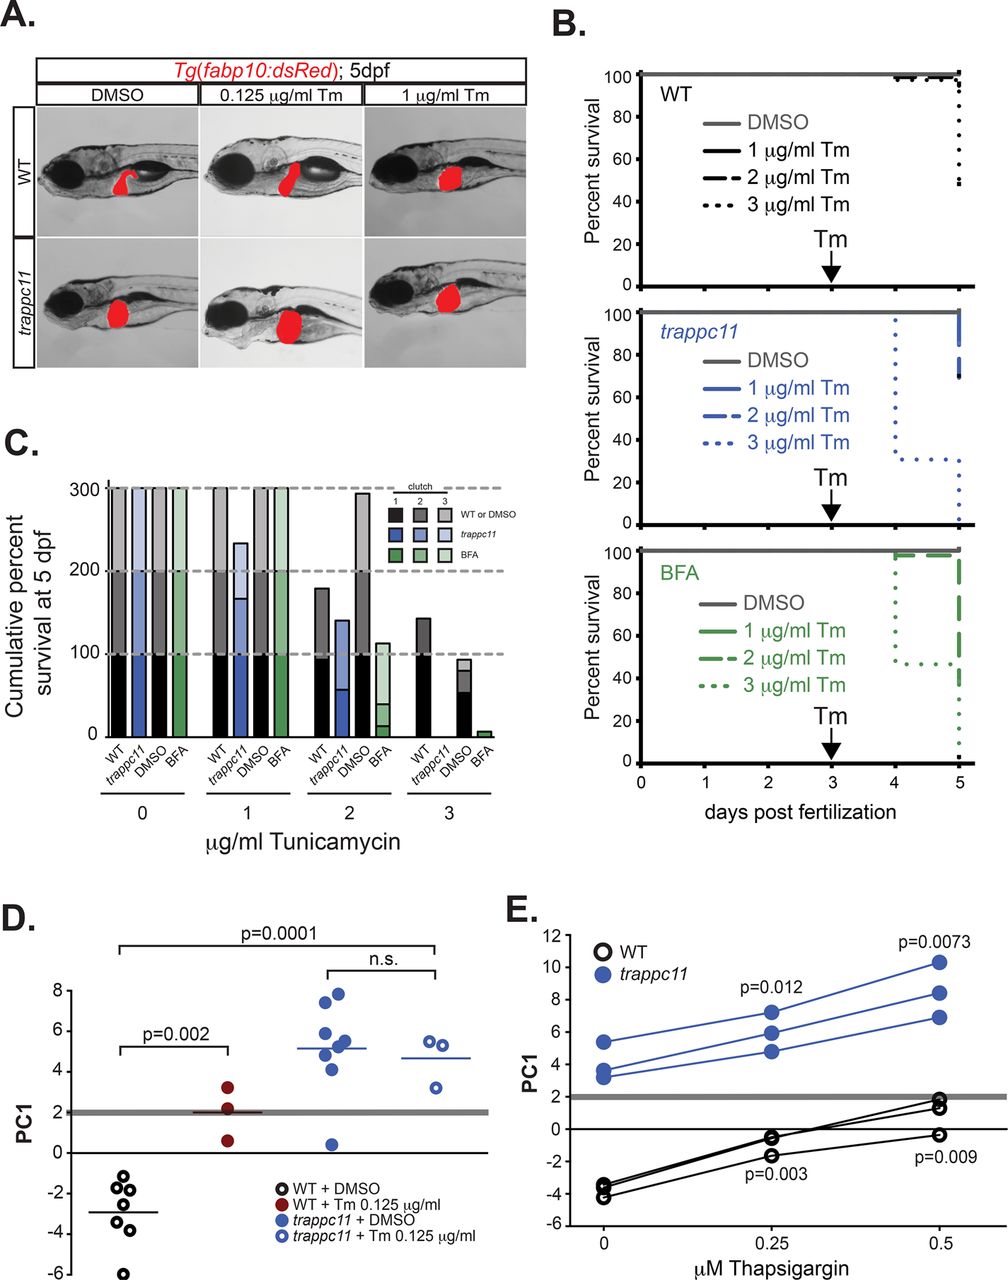
Tm phenocopies trappc11 mutants and synergizes with trappc11 mutation. (A) Transgenic WT and trappc11 mutant larvae that express a hepatocyte-specific marker (Tg(fabp10:dsRed)) were exposed to sublethal doses of Tm at 3 dpf and analyzed at 5 dpf for gross morphology. (B) WT, trappc11 mutants, and WT exposed to 0.5 µg/ml BFA were treated with increasing concentrations of Tm (1, 2, or 3 µg/ml) beginning at 3 dpf and scored for survival at 4 and 5 dpf (three clutches for each Tm concentration). WT, trappc11 mutants, and BFA-treated samples are respectively represented by black, blue, and green lines, with 1, 2, and 3 µg/ml Tm indicated by solid, dashed, and dotted lines, respectively. (C) Cumulative survival at 5 dpf of WT, trappc11 mutants, and WT + 0.5 µg/ml BFA exposed to Tm (1, 2, and 3 µg/ml) between 3 and 5 dpf. Black, blue, and green bars indicate WT, trappc11, and WT + BFA, respectively, with increased shading representing different clutches. Three clutches total were scored for survival. Gray segmented lines mark 100, 200, and 300% levels. (D) Livers from 5-dpf WT and trappc11 mutants treated with DMSO or 0.125 µg/ml Tm were collected and subjected to qPCR analysis for UPR-responsive genes, and PC1 metrics were calculated. Values for each individual sample. (E) Livers from 5-dpf WT and trappc11 mutants treated with DMSO, 0.25 µM thapsigargin, or 0.5 µM thapsigargin were collected and subjected to qPCR analysis for UPR-responsive genes, and PC1 metrics were calculated. The p values in C and D were calculated using Student’s t test. n.s., not significant.