
Image
|
Figure Caption
Fig. 10
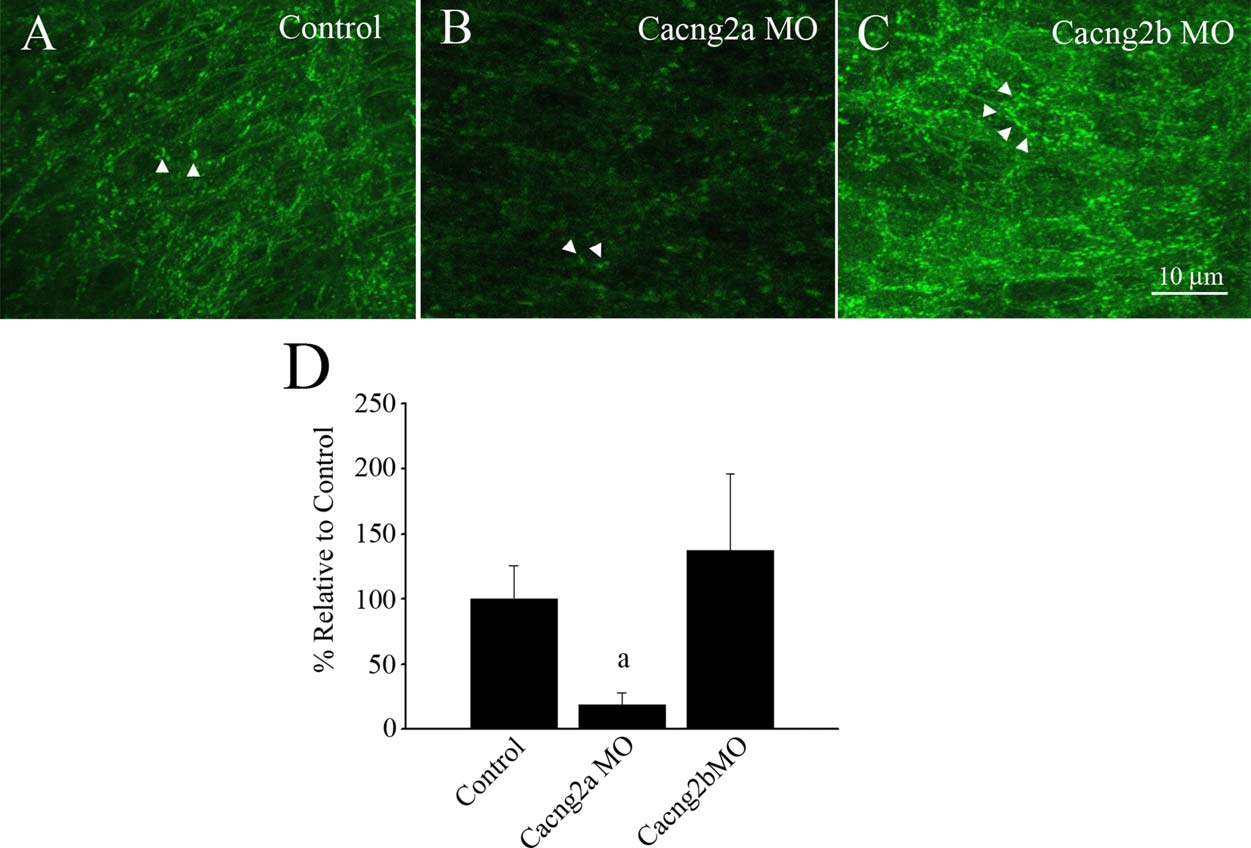
Immunohistochemical images of the zebrafish hindbrain labeled with anti-GluA2/3, from controls and splice-blocking morphants. (A) Control embryos, (B) Cacng2a morphants and (C) Cacng2b morphants. Arrowheads point to clusters of AMPA receptors (puncta). (D) Quantification of the number of puncta as a percentage of controls. aSignificantly different from controls, p < 0.05.
Figure Data
Acknowledgments
This image is the copyrighted work of the attributed author or publisher, and
ZFIN has permission only to display this image to its users.
Additional permissions should be obtained from the applicable author or publisher of the image.
Full text @ Dev. Neurobiol.