
|
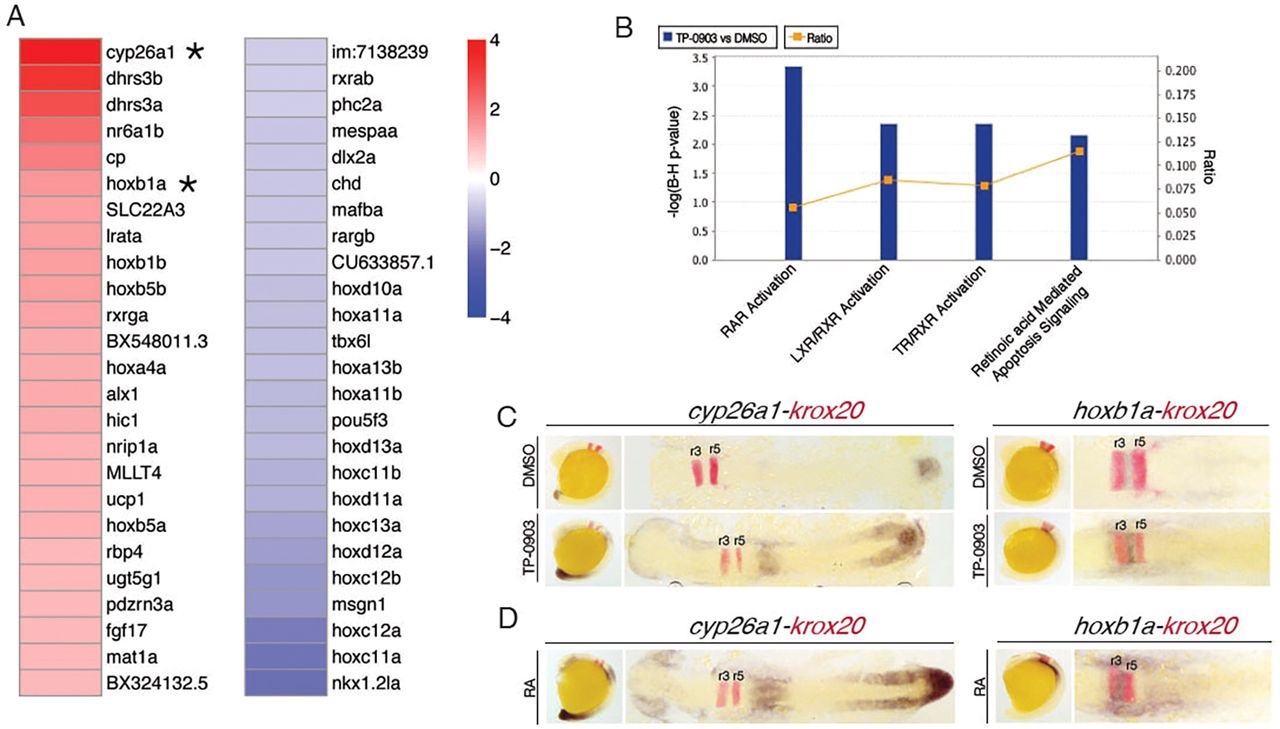
Fig. 5
TP-0903 acts by inducing retinoic acid signaling in zebrafish embryos. (A) Heat map schematic showing the 50 most differentially expressed transcripts from RNA-Seq as measured by log2 ratio from 4-h-treated DMSO and TP-0903 embryos. Asterisks indicate transcriptional targets of RA examined by whole-mount in situ hybridization in TP-0903-treated embryos. (B) Ingenuity pathway analysis of differentially expressed genes in TP-0903-treated embryos reveals that RA signaling pathways are exclusively activated. Bars represent the P-value for each RA pathway (expressed as 1×log of the P-value). The yellow line represents the ratio of the number of genes from our data set represented within each pathway to the total number of genes in each pathway. (C) Lateral (left panels) and dorsal (right panels) flat-mounted views of in situ hybridization at 16hpf for two genes, cyp26a1 and hoxb1a, identified as elevated by RNA-Seq after 4h TP-0903 treatment. In all panels, krox20 (red) is used as a marker of rhombomeres r3 and r5 (red stain). (D) Lateral (left panels) and dorsal (right panels) flat-mounted views of embryos treated at 13hpf with RA mimic TP-0903 expression effects on cyp26a1 and hoxb1a.