
|
Fig. S3
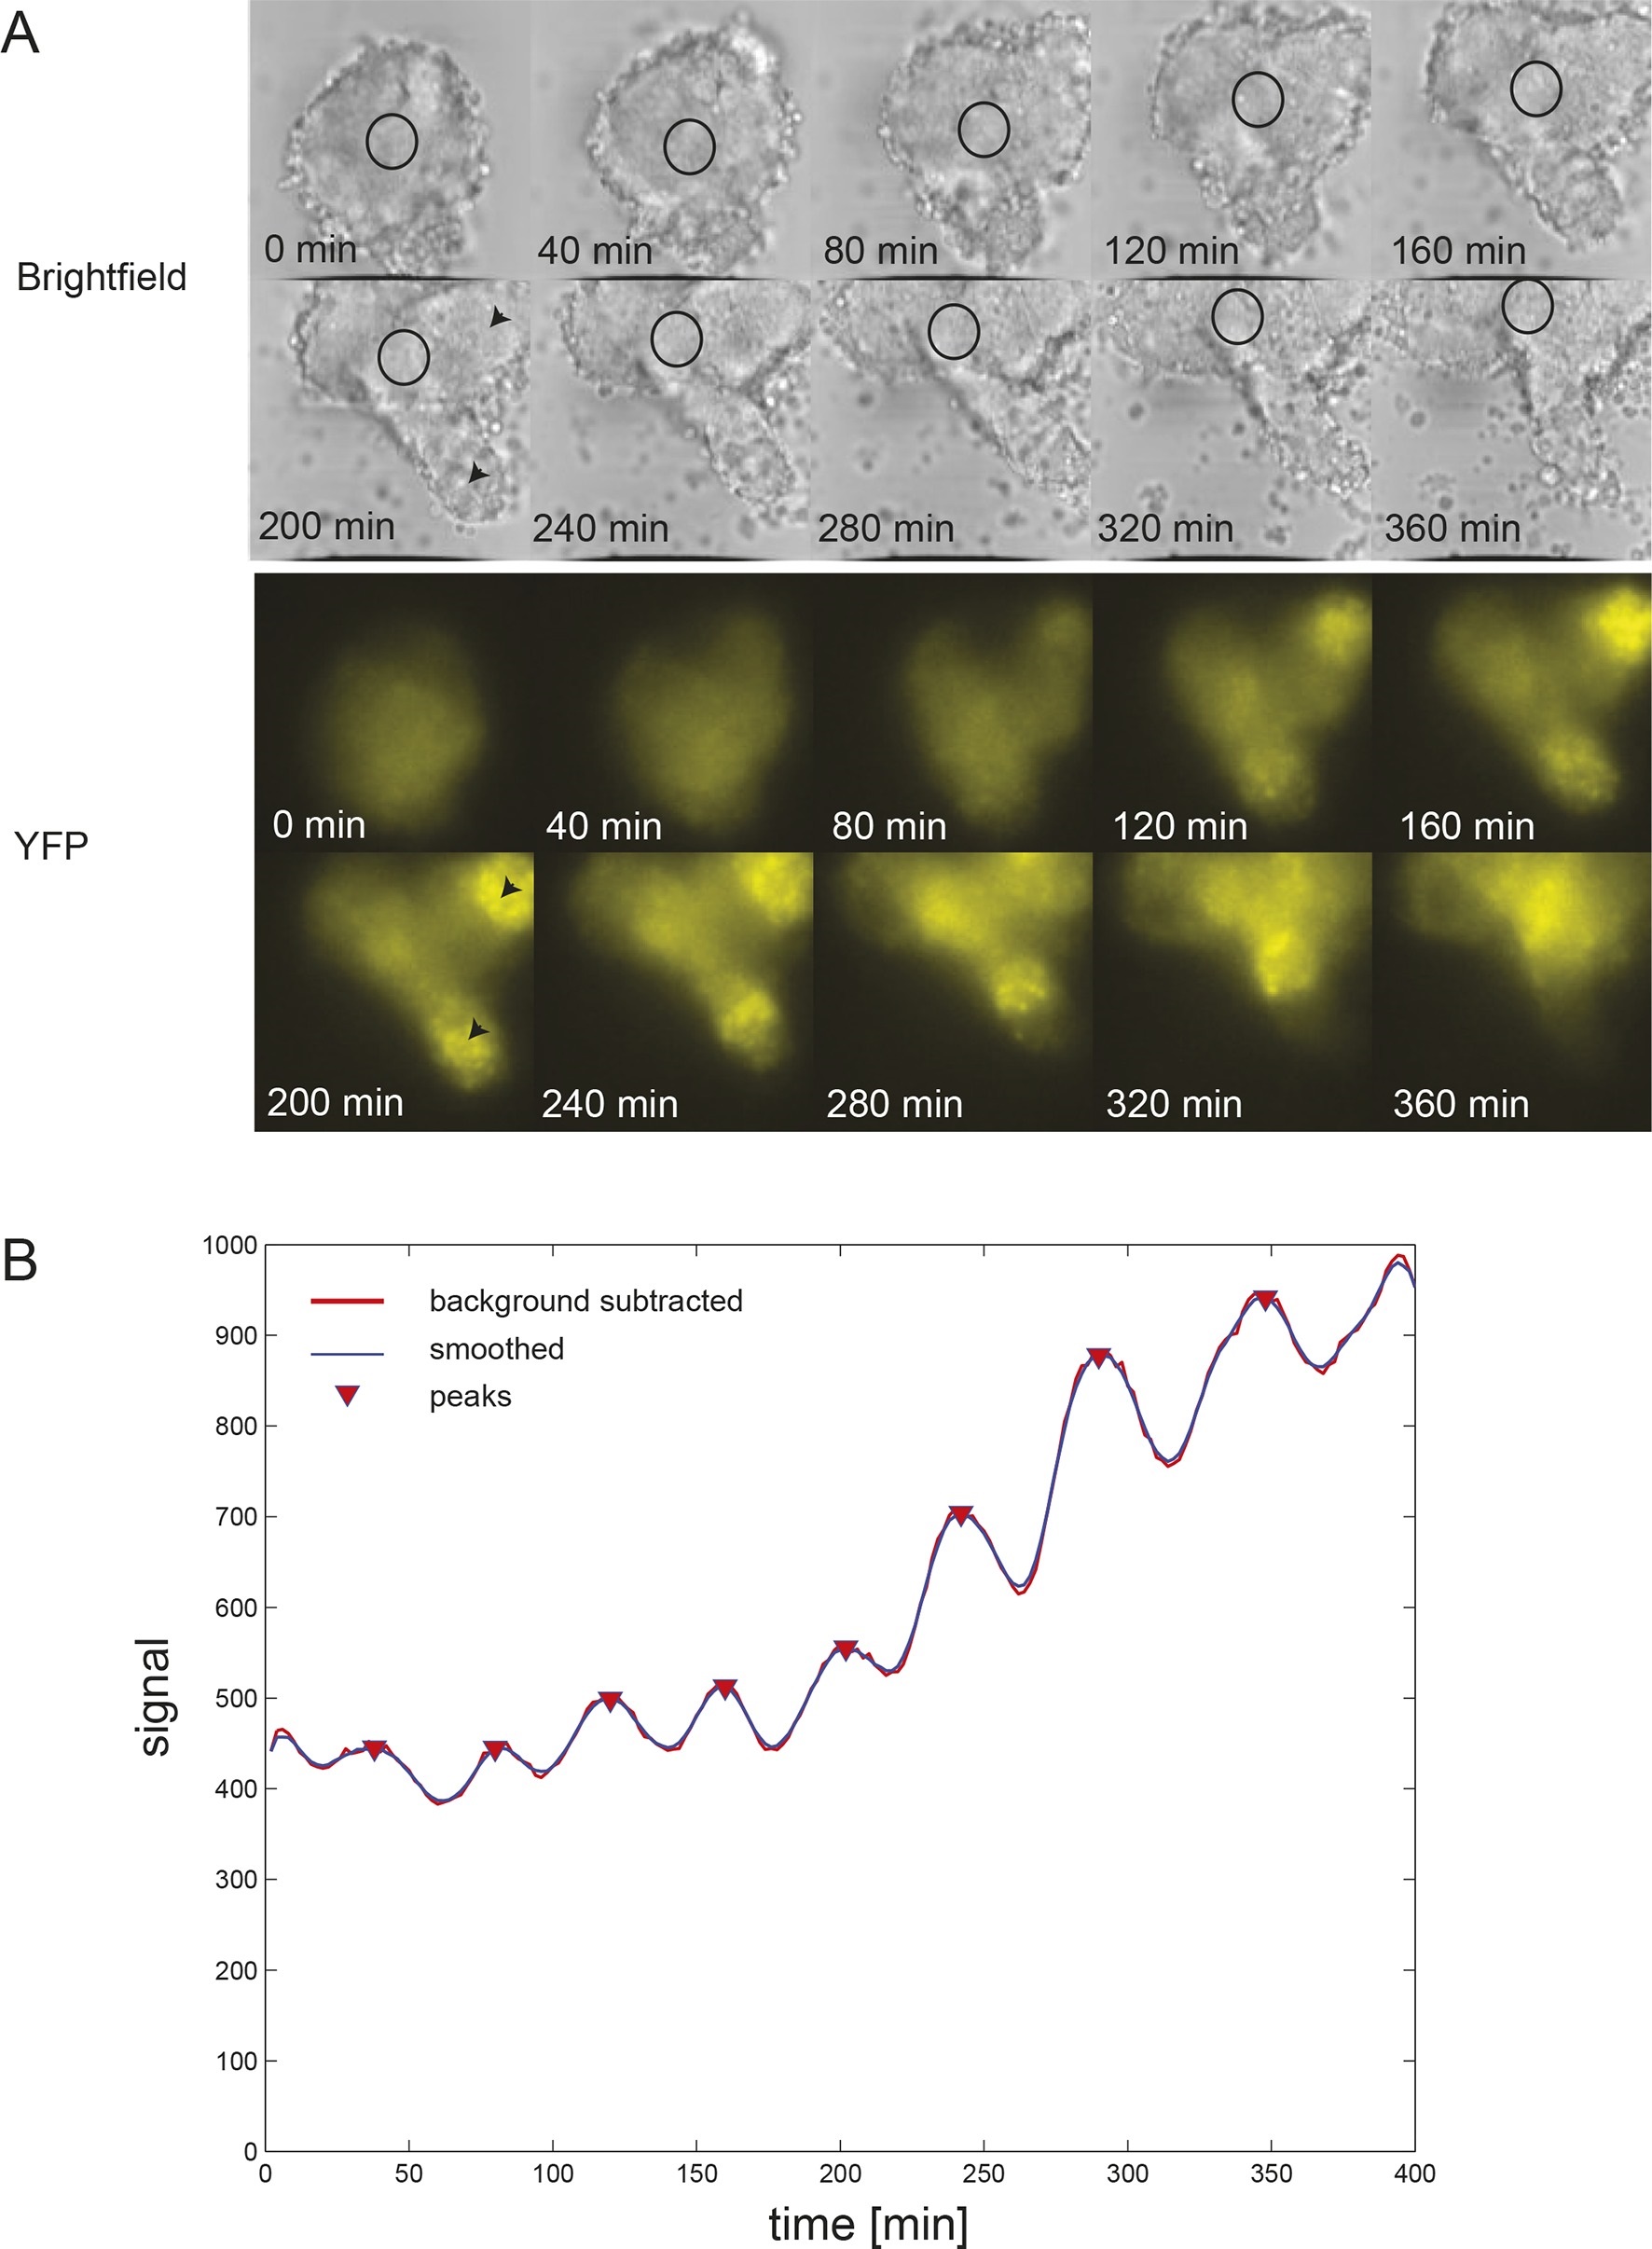
Persistent oscillations in explanted tailbud.(A) Montage of brightfield and corresponding YFP images from representative explanted tailbud over ~7 hr recording. Brightfield image is a single z-plane, while YFP signal is shown as an average projection of the entire stack. Oscillations in the tailbud were measured using a region of interest (ROI; black circle) to extract average YFP intensity values over time. We placed this region on the most central “tailbud” area, as we observed “PSM”-like protrusions (black arrowheads) emerging from the explant. These areas, as expected for PSM, showed brighter and increasing YFP expression over time, which then switched off. (B) Intensity over time plot for the ROI shown in A. The tailbud area shows 9 cycles over the recording with no slowing of the period. Peak finding was performed as in Figure 1-figure supplement 2: background subtracted raw data (thick red line) was smoothed (thin blue line) and peaks were identified (red down triangles).