
|
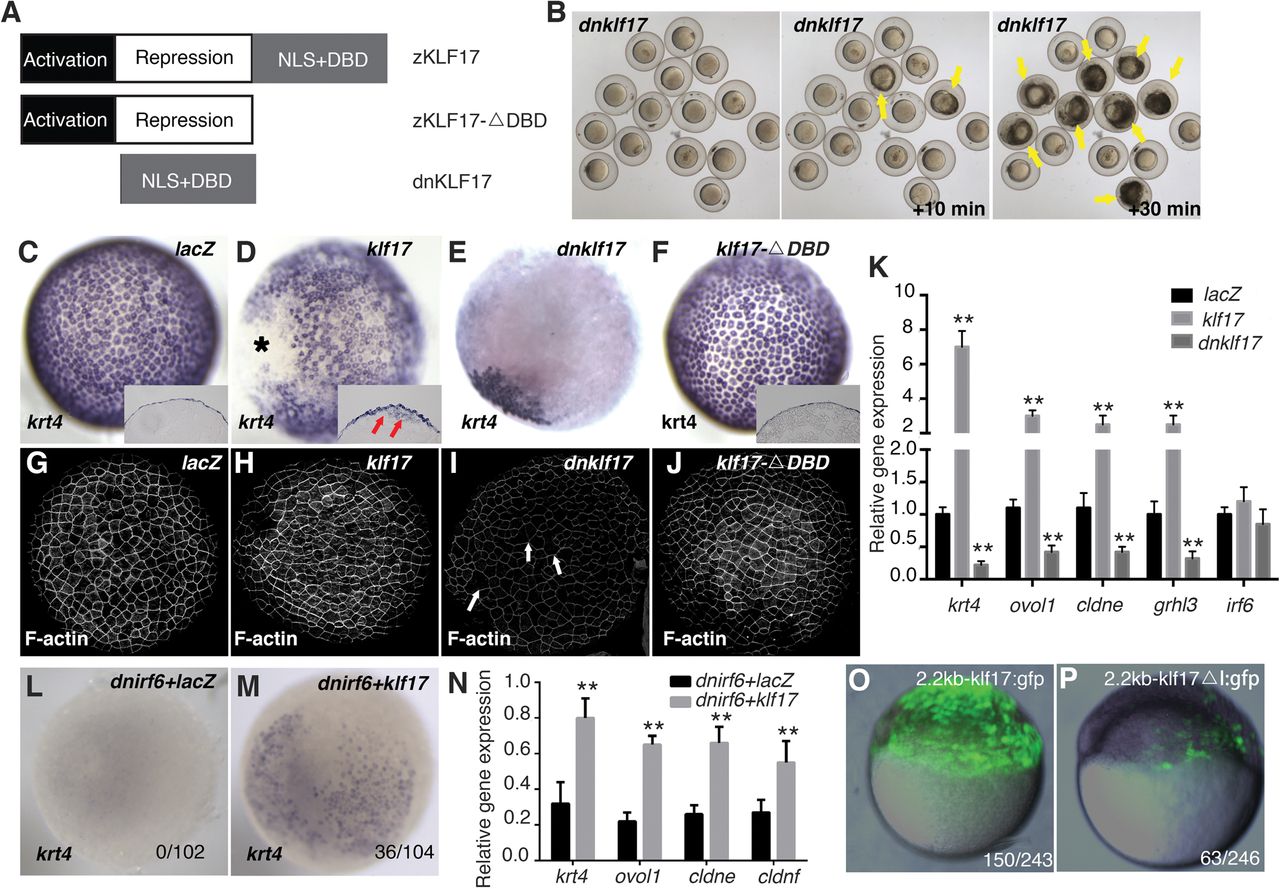
Fig. 1
KLF17 is an effector of IRF6 during differentiation of the embryonic zebrafish periderm. (A) Schematic of wild-type zebrafish Klf17 and of the variants used in this study. (B) Representative images of embryos injected at the 1-2 cell stage with RNA encoding dominant-negative Klf17 (dnklf17) shown at 6 hpf and at the indicated intervals later. Yellow arrows indicate rupture of the embryos. (C-J) Dorsal views of wild-type embryos injected at the one to two cell stage with the indicated mRNA construct, fixed at 5 hpf and processed to reveal (C-F) krt4 expression or (G-J) polymerized actin (phalloidin stain) (C-F, insets): cross-sections revealing that krt4 expression is confined to the superficial cell layer except in (F), where it is also observed in deep cells in a mosaic pattern, arrows. Asterisk in (F) indicates the ventral side of embryos. In (H) dnklf17-injected embryos, the overall level of phalloidin stain is lower than that in other groups, and there are occasional gaps in it, arrowheads. (Embryos dead at 6 hpf over number injected: lacZ, 2/89, dnklf17, 56/85, klf17-ΔDBD, 4/82, klf17, 6/84.) (K) Quantitation of periderm markers in dnklf17- and klf17-injected embryos (5 hpf), as assessed by qRT-PCR. Asterisks indicate statistical significance compared with the lacZ-injected control groups: *P < 0.05 and **P < 0.01. (L and M) Dorsal views of wild-type embryos injected with RNA encoding dominant-negative IRF6 (L) alone or (M) together with klf17 mRNA. Numbers at bottom right represent the ratio of unruptured/total injected embryos. (N) Quantitation of rescue of periderm markers by klf17 in dnirf6-injected embryos. Asterisks indicate statistical significance compared with the control group: **P < 0.01. (O and P) Representative images of GFP expression in transient transgenic zebrafish embryos injected with (O) the intact klf17 promoter and (P) one that lacks IRF6 binding sites (ΔI). The number at the bottom right represents the ratio of embryos with five or more GFP-periderm positive cells over the total number of injected embryos.