IMAGE

Fig. 4

ID
ZDB-IMAGE-160324-5
Source
Figures for Zhang et al., 2016
Image
Figure Caption

Fig. 4

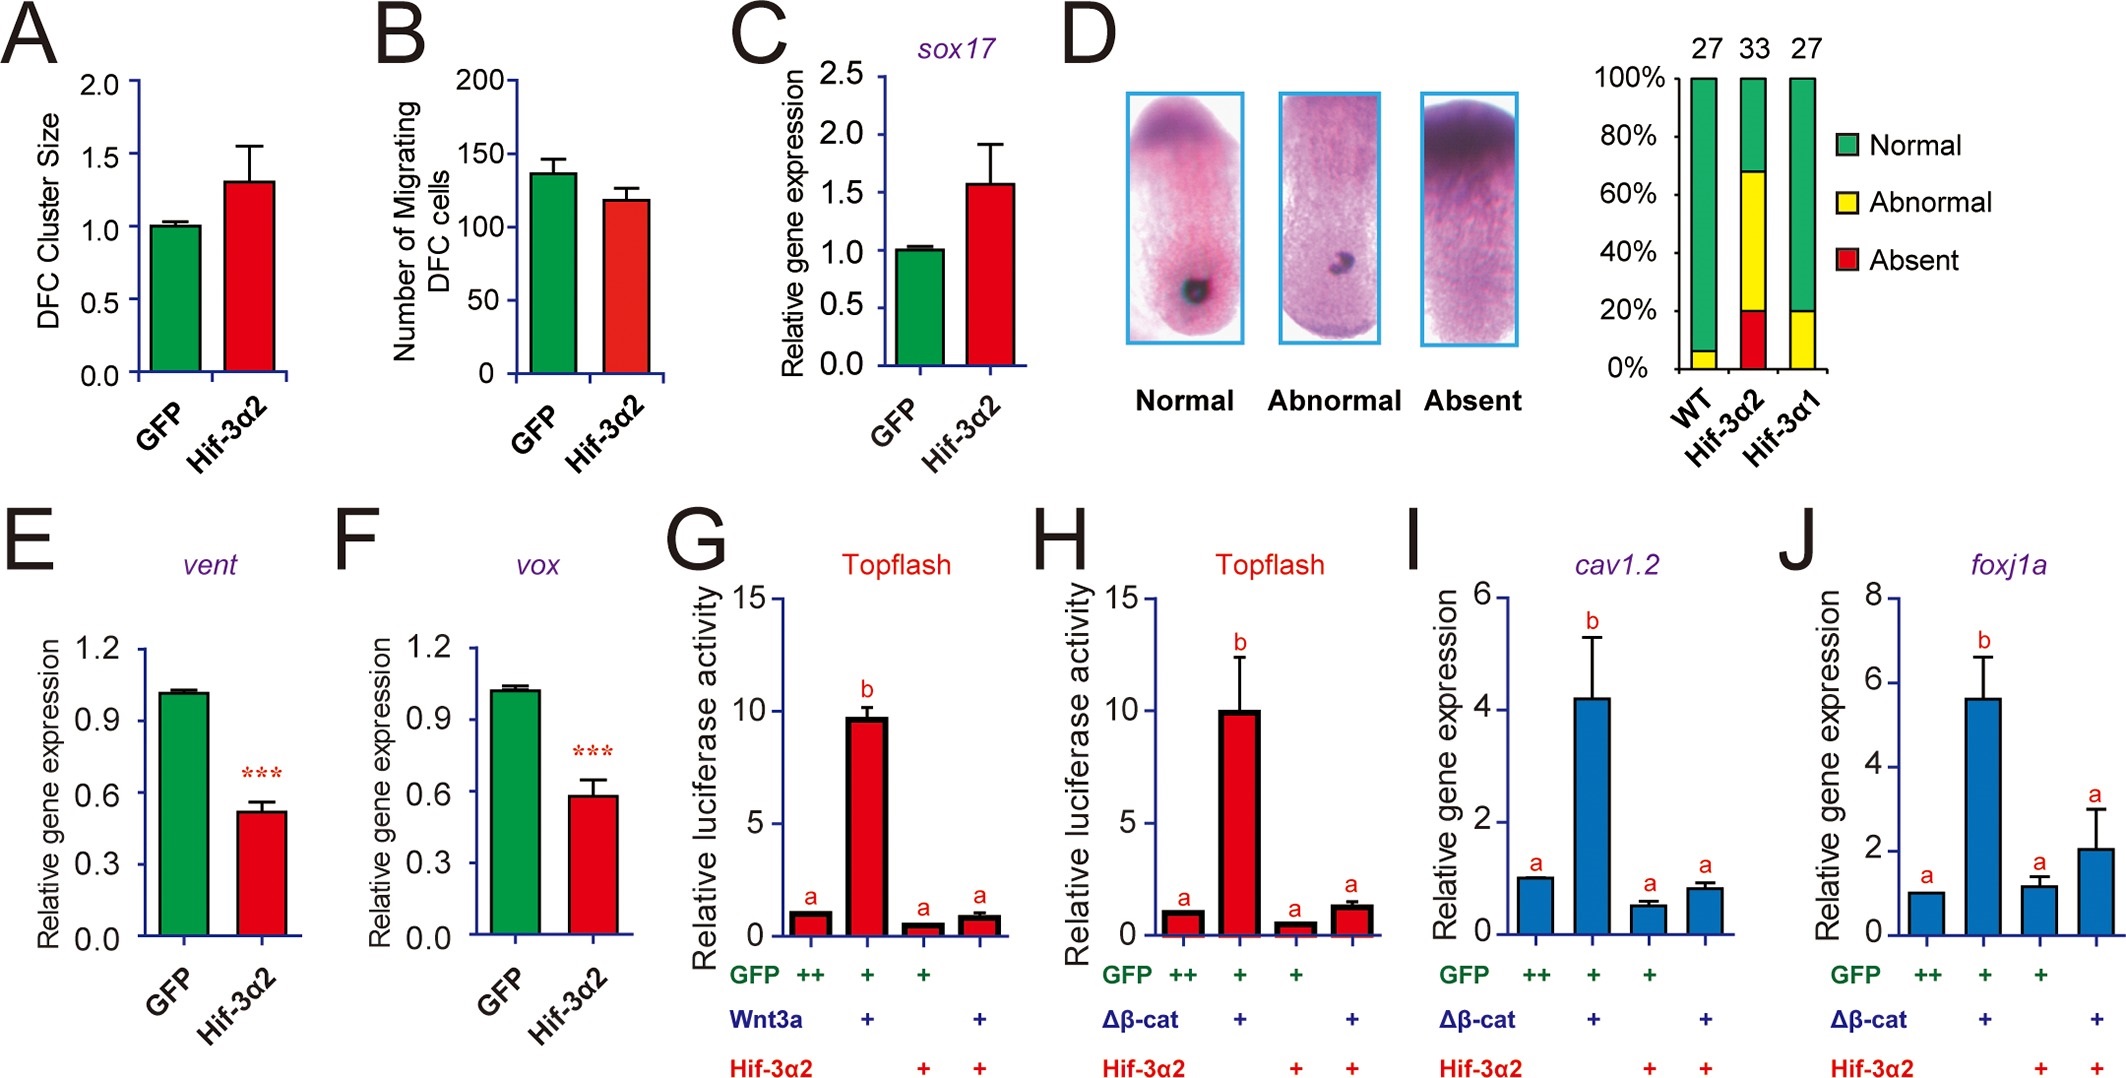
Forced expression of Hif-3α2 impairs Kupffer′s vesicle (KV) development and inhibits Wnt/β-catenin signaling.(A,B) Lack of effect on dorsal forerunner cell (DFC) development. The DFC cluster size (A) was determined by measuring sox17 mRNA expression domain in the Hif-3α2 mRNA injected embryos at 8 hpf (n = 22) using ImageJ. The values were normalized by those of the GFP mRNA injected embryos (n = 19). The number of migrating DFCs were quantified and shown in (B). (C) The sox17 mRNA levels were determined by qRT-PCR and normalized by the β-actin levels. Values are means +S.E. (n = 3). No significant difference is detected. (D) Effects on KV development. KV was visualized by charon mRNA expression at 12 hpf. The embryos were scored based on the criteria shown in the left panel. The quantification results are shown in the right. (E,F) Effects on Wnt target gene expression. Embryos injected with the indicated mRNA were raised to 9 hpf and vent (E) and vox (F) mRNA levels were determined by qRT-PCR and normalized to the β-actin levels. Values are means S.E. (n = 3). ***p < 0.001. (G,H) Inhibition of Wnt3a (G) and β-cateninΔN (H) activity. Embryos injected with Topflash plasmid DNA (90 pg) together with the 30 pg Wnt3a or 100 pg β-cateninΔN and 600 pg Hif-3α2 capped mRNA were raised to 9 hpf and luciferase activity was measured. Values are means S.E. (n = 3). Groups labeled with different letters are significantly different from each other (P < 0.05). (I,J) Inhibition of β-cateninΔN-induced cav1.2 (I) and foxj1a (J) expression.qRT-PCR was performed and analyzed as described above.

Acknowledgments
This image is the copyrighted work of the attributed author or publisher, and ZFIN has permission only to display this image to its users. Additional permissions should be obtained from the applicable author or publisher of the image. Full text @ Elife