
Image
|
Figure Caption
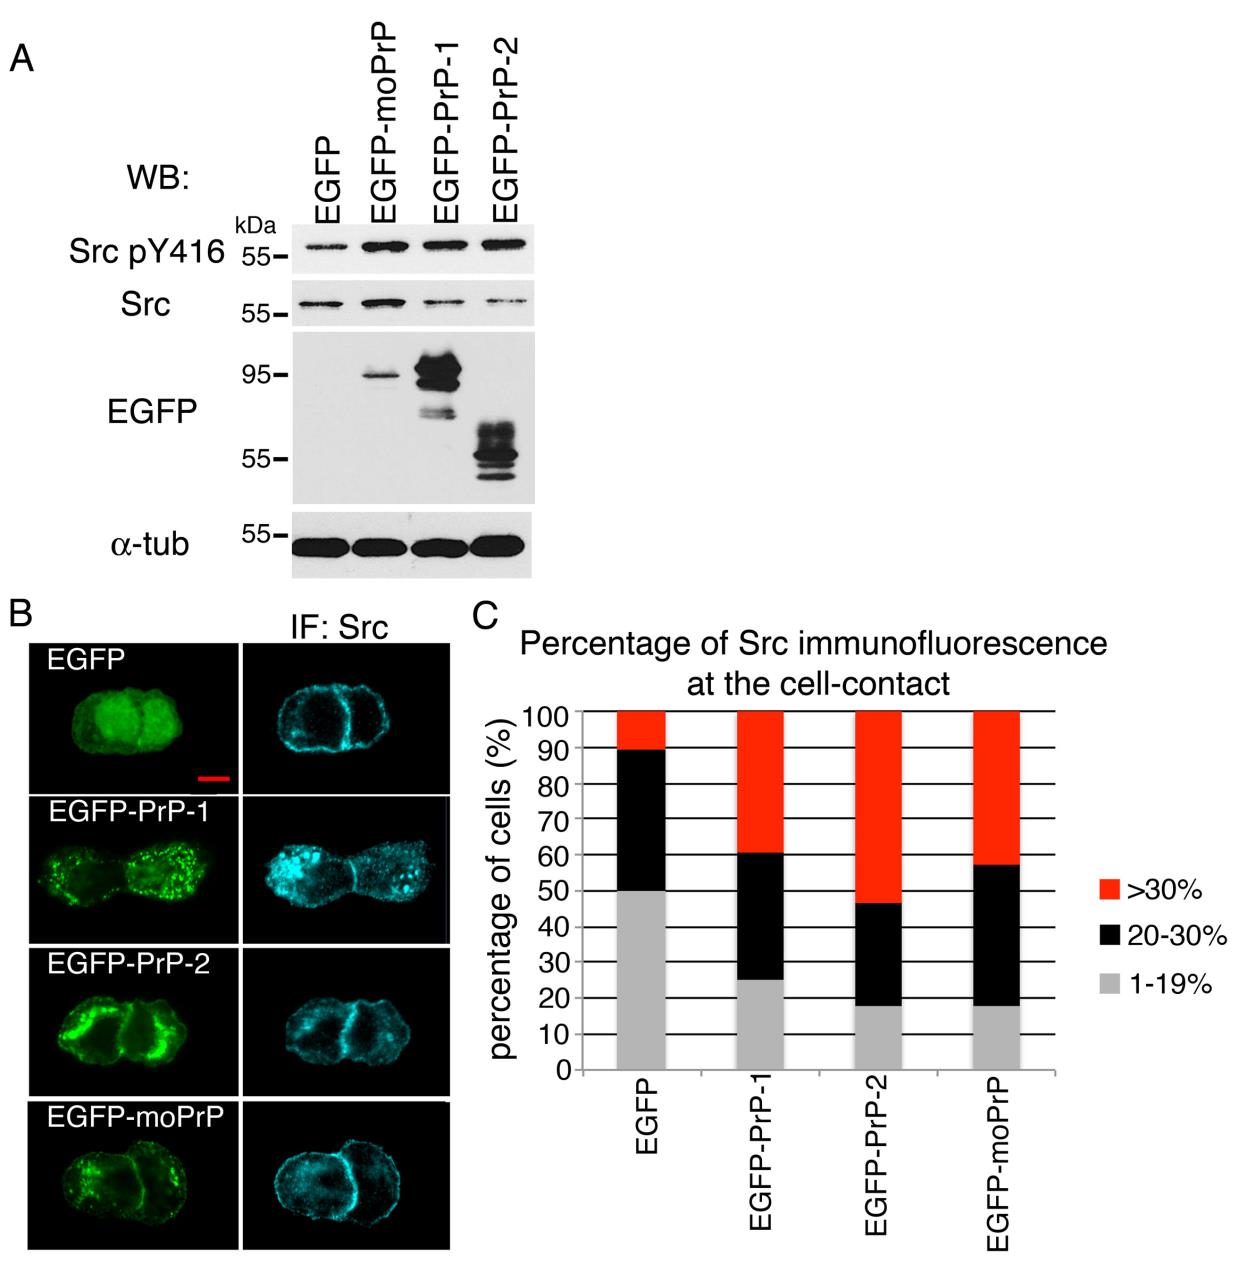
Fig. S6
Changes in Src activation and localization upon expression of mouse and zebrafish PrPs in MCF-7 cells. A. WB analysis with lysates of MCF-7 cells expressing EGFP-tagged PrPs. B. Subcellular distribution of EGFP-PrPs and Src immunofluorescence in MCF-7 cells. Scale bar = 10 µM. C. Quantification of Src immunofluorescence at cell-cell contact sites. Graph depicts percentages of cells (average values ± SEM) with different percentage of Src at cell-cell contact sites. Values were normalized to whole cell Src immunofluorescence.
Acknowledgments
This image is the copyrighted work of the attributed author or publisher, and
ZFIN has permission only to display this image to its users.
Additional permissions should be obtained from the applicable author or publisher of the image.
Full text @ Mol. Neurodegener.