
|
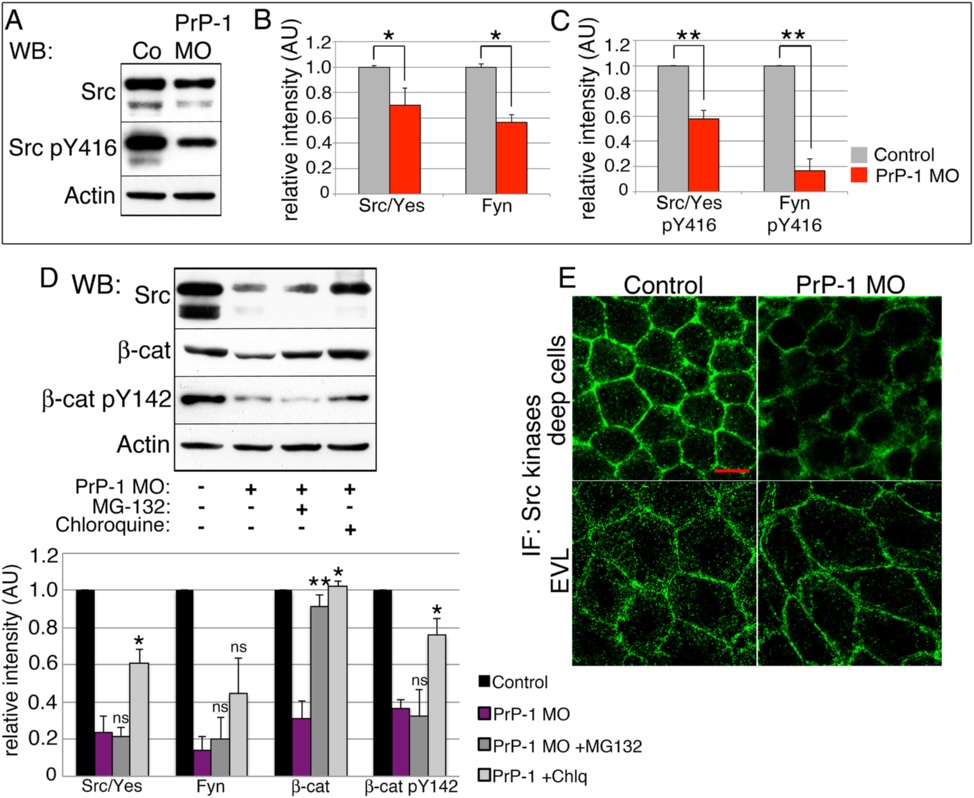
Fig. 4
PrP-1 modulates SFK levels and activation. a-c. Levels of total and activated (phosphor-Y416) SFKs in 6 hpf embryos (a), and densitometric analysis of Western blot bands (b and c). Phospho-SFK values were normalized to those of total SFKs. Average values ± SEM of four independent experiments are shown. d. SFK levels in 6 hpf embryos upon PrP-1 knockdown and additional treatment with degradation inhibitors. e. SFK localization in deep (top) and EVL cells (bottom) of 6 hpf embryos. WB = Western blot; IF = immunofluorescence. Scale bar = 10 µM. Densitometric analysis of Western blot bands (b, c and d) is expressed in arbitrary units (AU); average values of four independent experiments ± SEM are shown; statistical significance was assessed using unpaired, two-tailed t-tests; ns = not significant (p > 0.05), * = p ≤ 0.05, ** = p ≤ 0.01. See also Additional file 1: Figure S3.