
IMAGE
Fig. S1
- ID
- ZDB-IMAGE-160315-8
- Publication
- Samuel et al., 2016 - Six3 regulates optic nerve development via multiple mechanisms
- All Figures
- Figures for Samuel et al., 2016
Image
|
Figure Caption
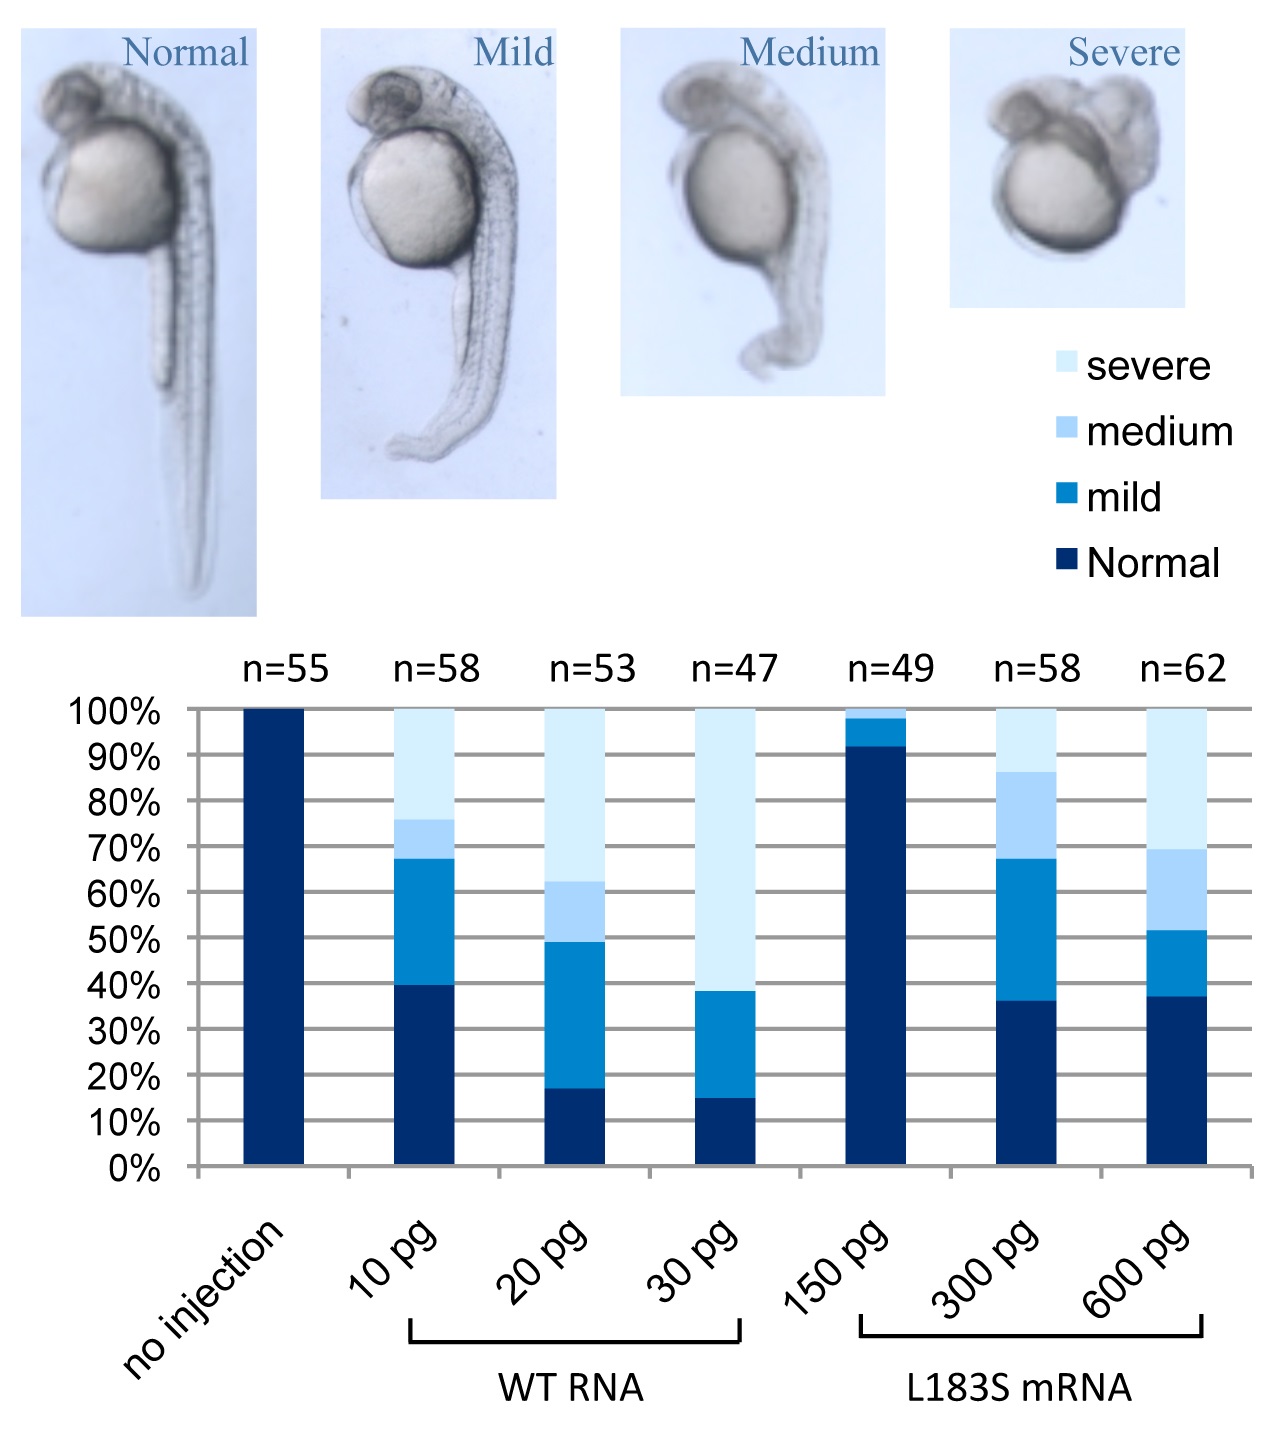
Fig. S1
Results of normal six3a0 and six3avu129 misexpression. Live embryos at 26 hpf after injection of synthetic RNA encoding normal or mutant Six3aL183S. Four phenotypic groups were scored: normal looking, mild: slightly dorsalized, medium: moderately dorsalized and severe: strongly dorsalized. The percentage of embryos from each group after injection of different doses of normal or mutant six3a RNA is shown in the graph, with phenotypes color-coded. The number (n) of embryos in each group and injection doses are depicted on top and bottom of bars, respectively.
Acknowledgments
This image is the copyrighted work of the attributed author or publisher, and
ZFIN has permission only to display this image to its users.
Additional permissions should be obtained from the applicable author or publisher of the image.
Full text @ Sci. Rep.