
|
Fig. 3
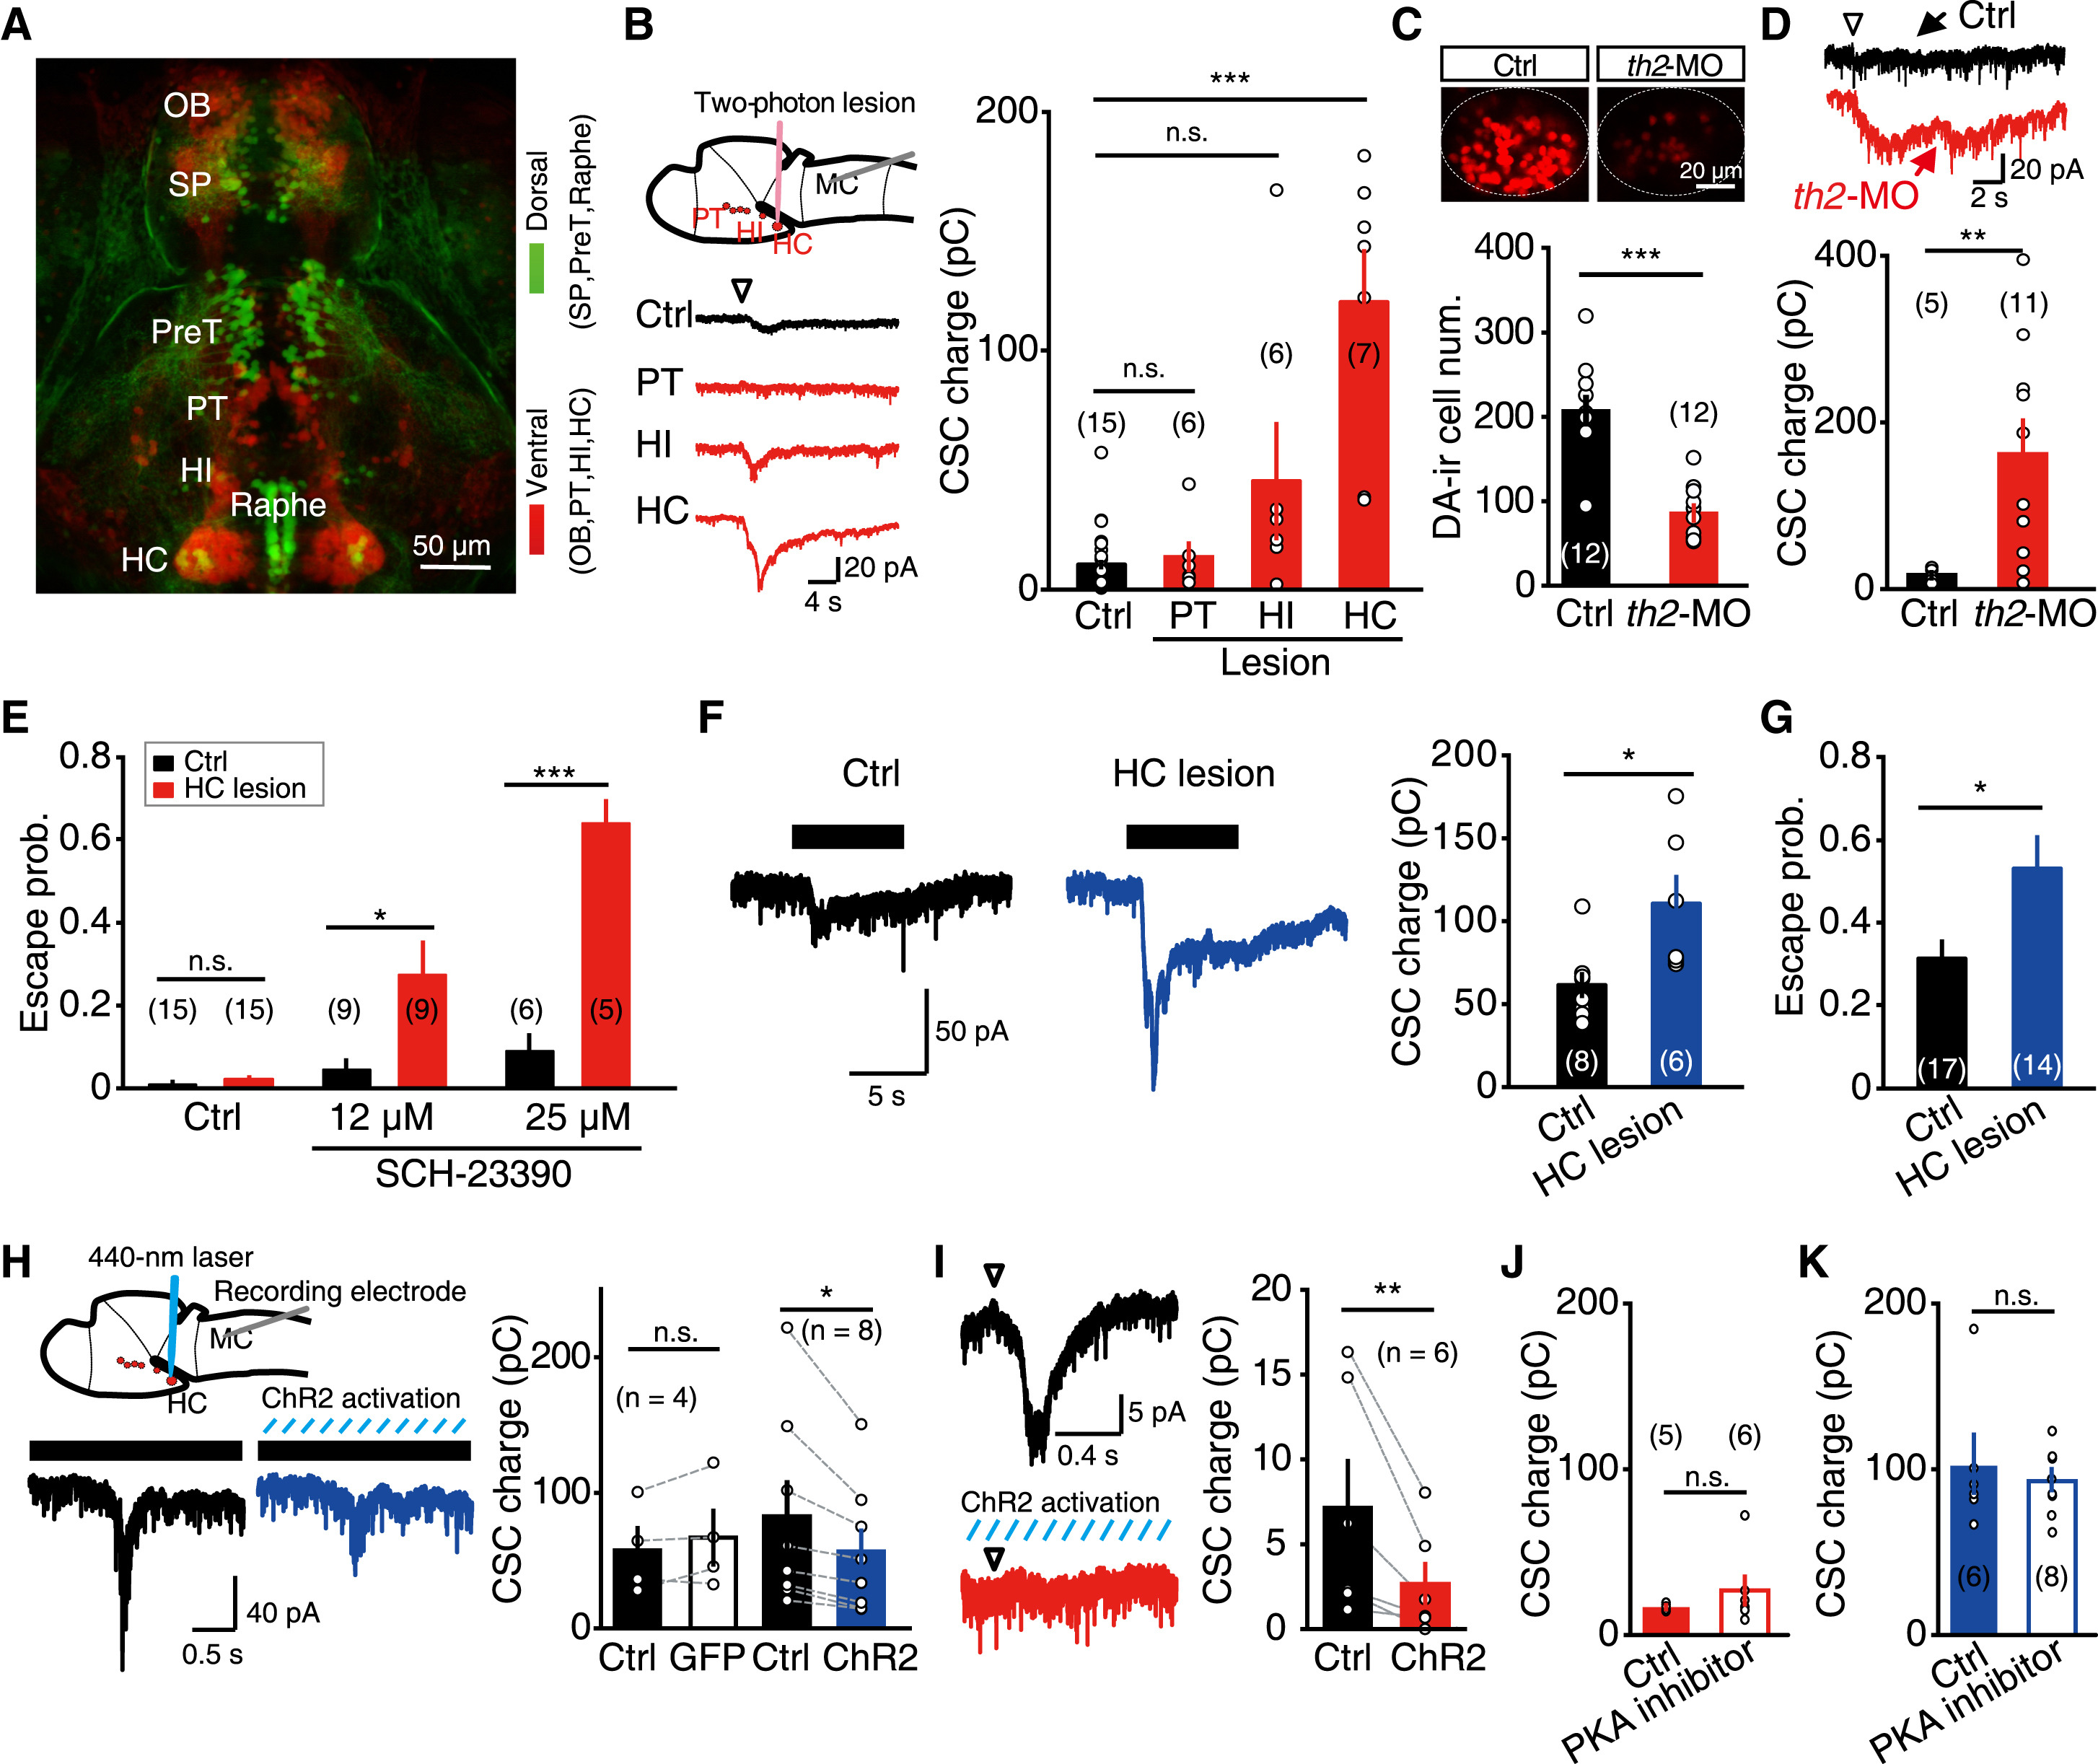
Hypothalamic Dopaminergic Neurons Control Visuomotor Transformation
(A) Projected confocal pseudocolor image of a 5 dpf ETvmat2:GFP larva, in which GFP was expressed in monoaminergic neurons. HC, caudal hypothalamus; HI, intermedial hypothalamus; OB, olfactory bulb; PreT, pretectum; PT, posterior tuberculum; Raphe, raphe nucleus; SP, subpallium. Green and red indicate relative dorsal and ventral distribution, respectively.
(B) Effects of two-photon laser-based lesion of dopaminergic neurons in the PT, HI, and HC on MC flash responses. Left top, schematic of experiment paradigm; left bottom, samples of MC responses under control or lesion conditions; right, summary.
(C) Example (top) and summary (bottom) of data showing the effect of MO-based th2 knockdown (“th2-MO”) on the number of dopamine-immunoreactive neurons in the HC.
(D) Example (top) and summary (bottom) of data showing the effect of MO-based th2 knockdown on MC responses evoked by 15 ms flash stimuli (arrowhead at top).
(E) Effects of HC lesion on the probability of flash-evoked escape behavior in the control (Ctrl) condition or in the presence of low doses of SCH-23390 (12 µM or 25 µM).
(F) Example (left) and summary (right) of data showing the effect of HC lesion on expanding stimulus-evoked responses of MCs.
(G) Effects of HC lesion on the probability of expanding stimulus-evoked escape behavior.
(H) Effect of the optogenetic activation of HC dopaminergic neurons on expanding stimulus-evoked MC responses. Left top, schematic of experimental paradigm: in vivo whole-cell recording was performed in one MC, and 440 nm laser was used to scan the middle layer of the ipsilateral HC in Tg(DAT:ChR2) larvae. Left bottom, sample traces showing MC responses evoked by expanding stimuli under the control condition (“Ctrl”) or optogenetic activation (“ChR2 activation”). Both sample traces are averaged of 5 trials. The italic blue lines represent 440 nm laser stimulation. Right, summary.
(I) Example (left) and summary (right) of data showing the effect of the optogenetic activation of HC dopaminergic neurons on flash-evoked MC responses.
(J and K) Effect of intracellular loading of the PKA inhibitor PKI (6-22) amide on flash- (J) or expanding stimulus-evoked (K) MC responses.
n.s., not significant; *p < 0.05, **p < 0.01, ***p < 0.001; error bars, SEM.
See also Figure S3.