
|
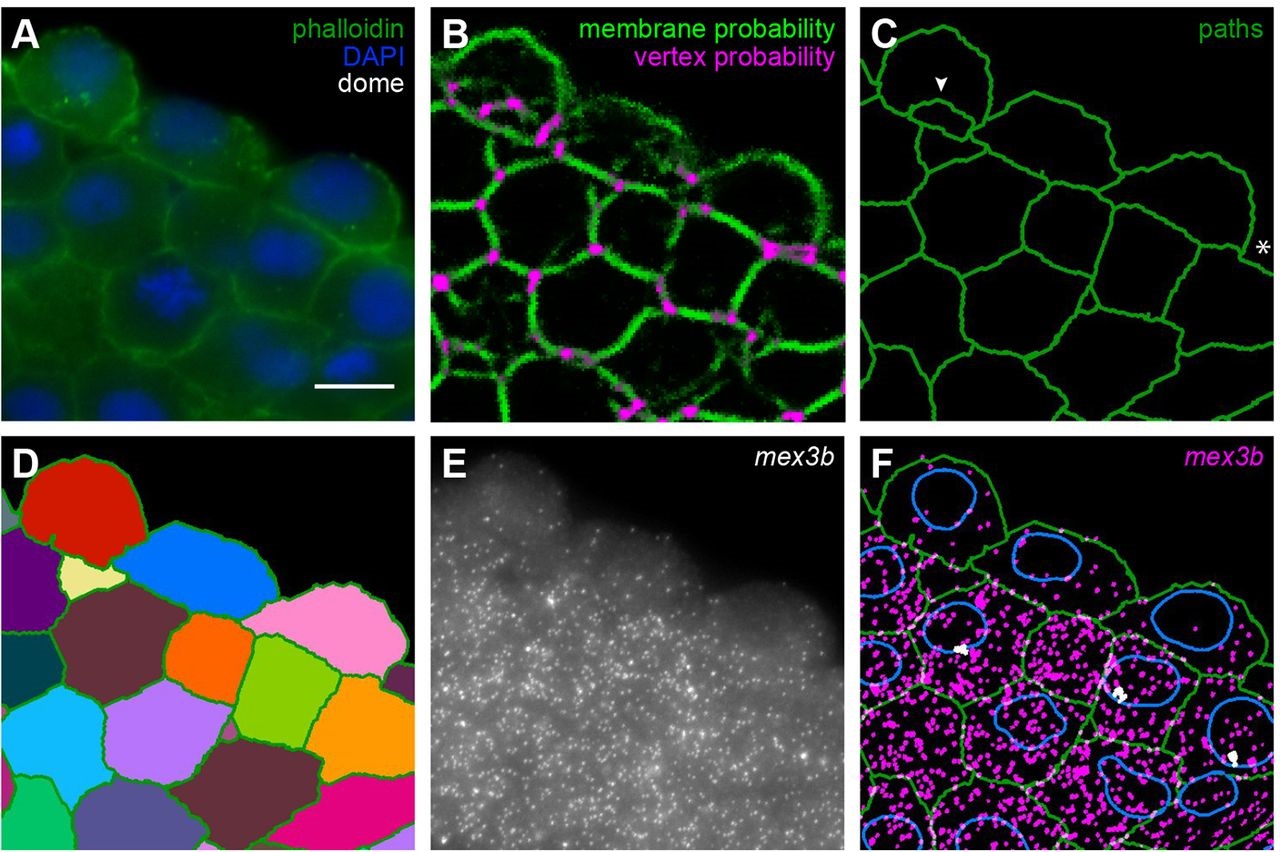
Fig. 2
Automated membrane detection to assign transcripts to cells and nuclei. (A) Phalloidin staining (green) and DAPI staining (blue) on an smFISH sample to identify cell membrane and nuclei. (B) Output of the Cascaded Random Forest classification for membrane (green) and vertex points (magenta) performed on A. (C) Membrane traces (green) generated with the PathFinder tool, using the classified membrane and the vertex points from B as input. Arrowhead indicates over-segmentation, asterisk indicates under-segmentation. (D) Cell mask after manual correction of membrane traces. (E) smFISH for mex3b. (F) Combined detection of transcripts (magenta), transcription foci (white), outlines of cells (green) and nuclei (blue). Scale bar: 10µm.