
|
Fig. 2
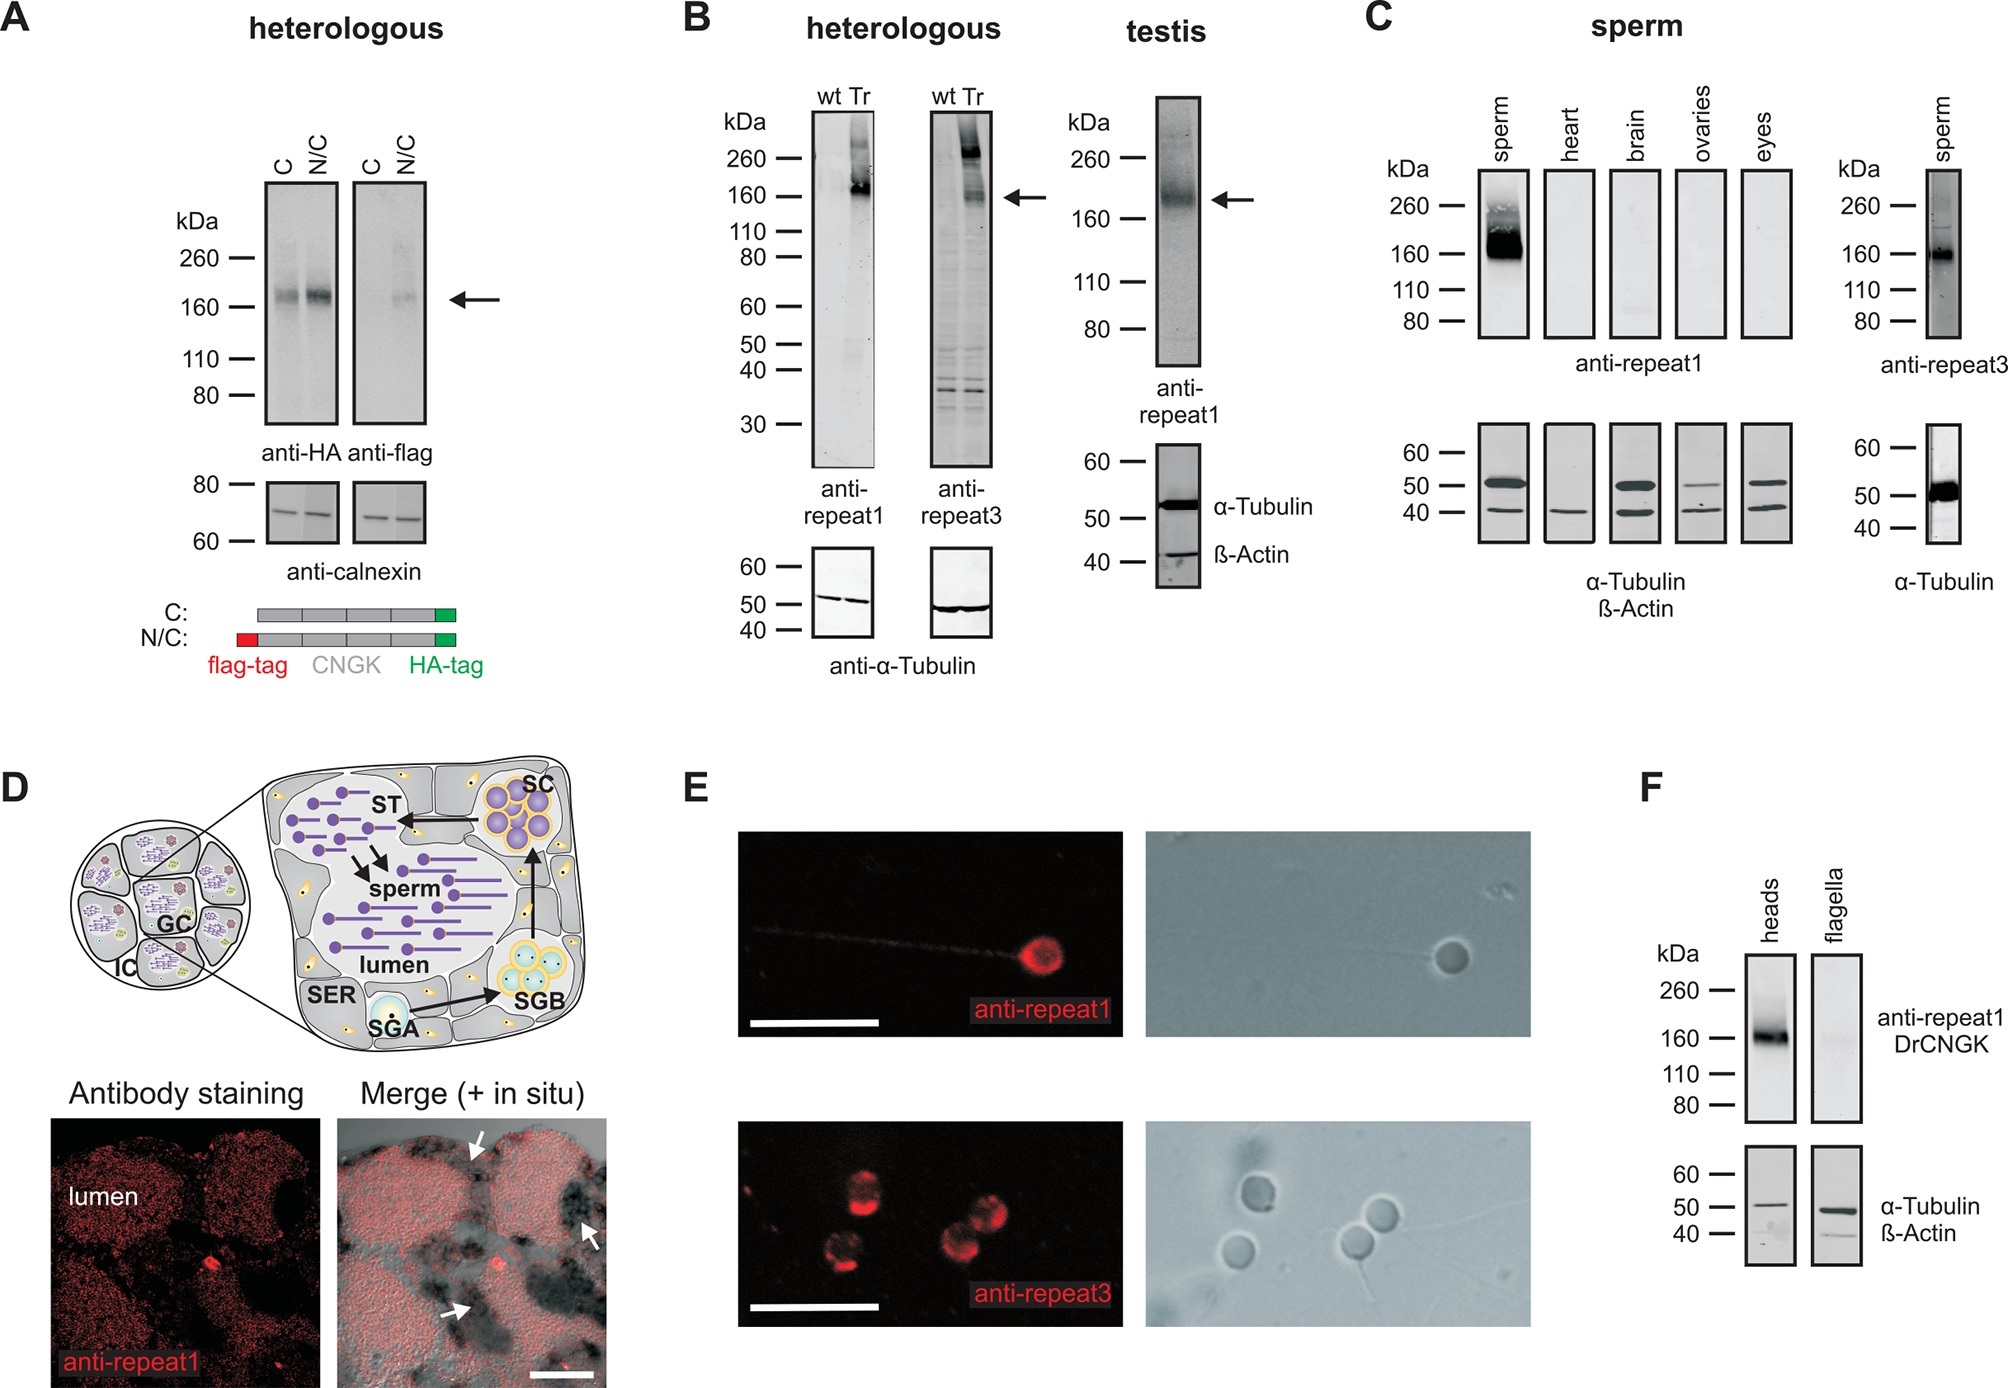
Localization of the DrCNGK channel.(A) Western blot of membrane proteins (15 µg) from CHOK1 cells transfected with cDNA encoding either DrCNGK with a C-terminal HA-tag alone (lane C) or with both, a C-terminal HA-tag and an N-terminal flag-tag (N/C). Apparent molecular weight Mw is indicated on the left. (B) Characterization of anti-DrCNGK antibodies. Left: Western blot of membrane proteins (10 µg) from HEK293 cells transfected with cDNA encoding DrCNGK (Tr) and wild-type cells (wt). Right: Western blot of membrane proteins (15 µg) from zebrafish testis. (C) Western blot of membrane proteins (15 µg) from different zebrafish tissues. (D) Upper panel: Scheme of a testis cross-section. GC, germinal compartment; IC, intertubular compartment; SER, Sertoli cells; SGA, primary spermatogonia; SGB, secondary spermatogonia; SC, spermatocytes; ST, spermatids; scheme according to (Nobrega et al., 2009). Lower panel: Staining with anti-repeat1 antibody (red, left) and superposition (right) of the immunohistochemical image with a bright-field image of an in situ hybridization using an anti-DrCNGK-specific RNA probe (arrows). Bar represents 50 µm. (E) Staining of zebrafish sperm with anti-repeat1 (upper left panel) and anti-repeat3 antibody (lower left panel). Bars represent 10 µm. The respective bright-field images are shown (upper and lower right panels). (F) Western blot of equal amounts of total membrane proteins (15 µg) from purified heads and purified flagella.