
|
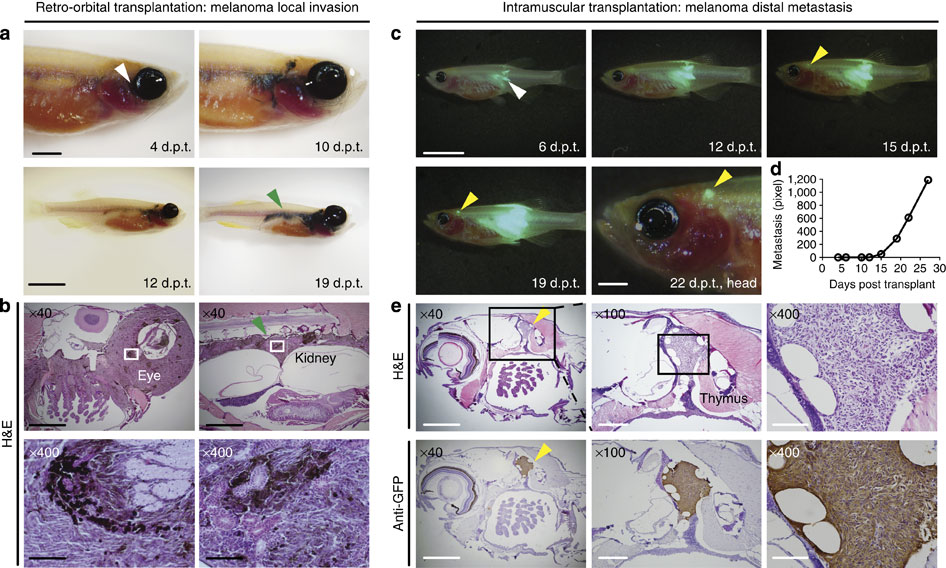
Fig. 5
Visualizing melanoma invasion and metastasis following engraftment into rag2E450fs (casper) (casper) mutant fish.
(a) Invasion assays using retro-orbital transplantation of a BRAFV600E, tp53-/- pigmented melanoma. White arrow denotes the site of injection. Green arrow denotes spread to the kidney marrow that is contiguous with primary tumour growth that has arisen adjacent to the eye. Histological examination confirmed the presence of pigmented melanoma cells at the site of injection (b, left panels) and contiguous with the trunk kidney (b, right panels). (c) Metastasis assays using implantation of non-pigmented, GFP-labelled melanoma cells into the dorsal musculature of rag2E450fs (casper)-recipient fish. White arrow denotes the site of injection. Yellow arrow denotes site of distal metastasis. (d) Quantification of metastatic growth as assessed by epi-fluorescence microscopy over time. (e) Haematoxylin and eosin-stained sections of the same animal imaged in c, confirming metastatic growth of melanoma adjacent to the thymus (top panels) and confirmed by anti-GFP immunostaining on section (bottom panels). Scale bars equal 5 mm for whole animal images, 2 mm in images of heads, 1 mm in × 40 histological images; 300 µm in × 100 histological images and 100 µm in × 400 histological images.