
Image
|
Figure Caption
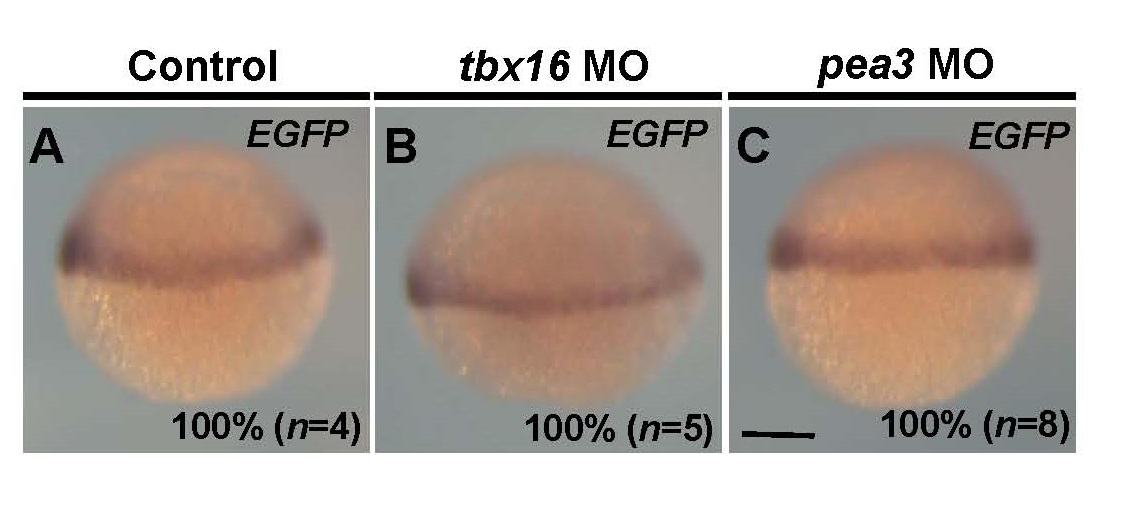
Fig. S1 Expression patterns of EGFP mRNA in the tbx16 MO- or pea3 MO-injected embryos. (A-C). Whole-mount in situ hybridization at 60% epiboly. MO specific to tbx16 was injected into the fertilized embryos of Tg(hes6:EGFP-SV40) at a concentration of 1.0 µg/µl. MO specific to pea3 at a concentration of 2.0 µg/µl. Lateral views. The percentage of embryos showing the expression patterns of EGFP shown in the panels relative to those of injected EGFP-positive embryos (n) is shown at the bottom-right of each panel. All images were taken at the same magnification. Scale bar, 200 µm.
Acknowledgments
This image is the copyrighted work of the attributed author or publisher, and
ZFIN has permission only to display this image to its users.
Additional permissions should be obtained from the applicable author or publisher of the image.
Reprinted from Developmental Biology, 409(2), Kawamura, A., Ovara, H., Ooka, Y., Kinoshita, H., Hoshikawa, M., Nakajo, K., Yokota, D., Fujino, Y., Higashijima, S.I., Takada, S., Yamasu, K., Posterior-anterior gradient of zebrafish hes6 expression in the presomitic mesoderm is established by the combinatorial functions of the downstream enhancer and 3'UTR, 543-54, Copyright (2016) with permission from Elsevier. Full text @ Dev. Biol.