
Image
|
Figure Caption
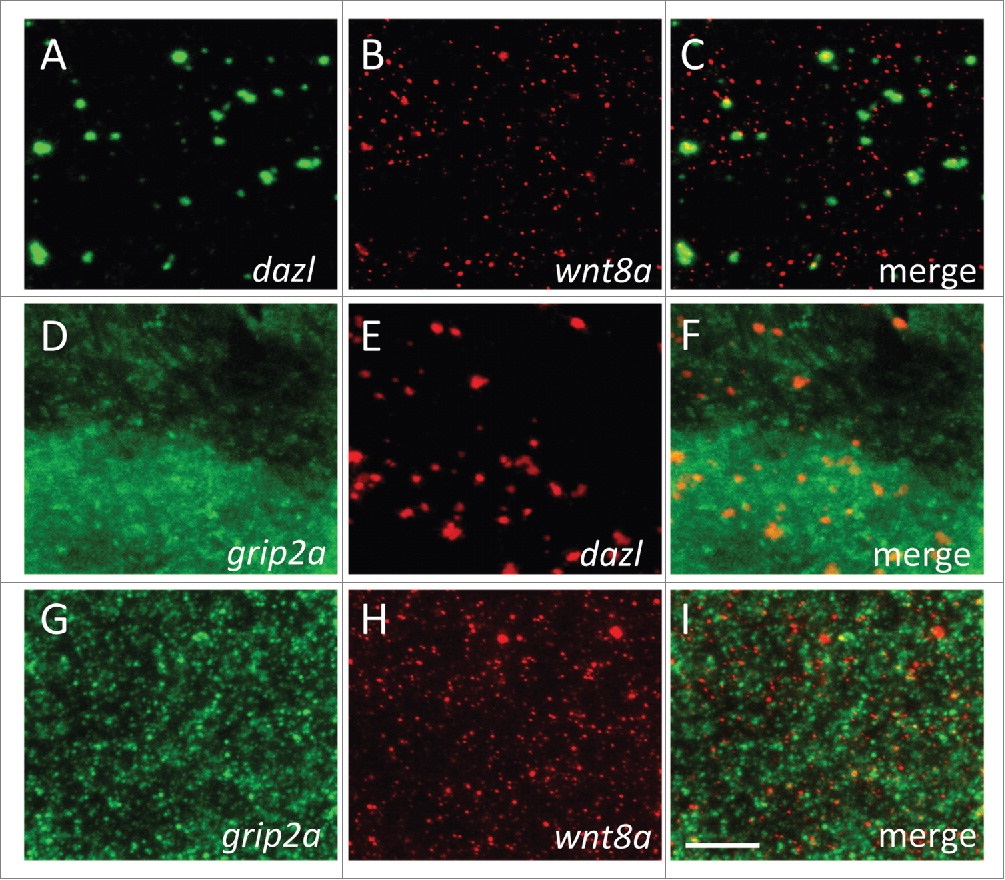
Fig. 3
Figure 3. Colocalization analysis of wnt8a, grip2a and dazl mRNA localization. (A-C) 3-D rendering of dual labeled FISH for pairwise comparisons: (A) wnt8a (red) and dazl (green); (B) grip2a (green) and dazl (red); and (C) grip2a (green) and wnt8a (red). (D-F) Quantification of particles according to cortical depth within a 9 µm section of the vegetal half of the embryo divided into outer (0 – 2.997µm), intermediate (3.087 – 5.994 µm) and most internal (6.084 – 9µm) (see Methods). Particles containing wnt8a and grip2a mRNAs are enriched in the outer section whereas particles containing dazl mRNA are enriched in the inner section. Brackets indicate comparisons evaluated for statistical significance, with green and red bracket colors corresponding to FISH label. Asterisks indicate statistical significance according to a Comparing Means T-test (StatPlus), with p-values as follows: (D) p = 0 .02 and 0.006 for dazl and wnt8a, respectively; (E) p = 0 .001 and 0.07 for dazl and grip2a, respectively; (F) p = 0 .01 and 0.5 for grip2a and wnt8a, respectively. Scale bar in (C) represents 5µm for panels (A-C).
Acknowledgments
This image is the copyrighted work of the attributed author or publisher, and
ZFIN has permission only to display this image to its users.
Additional permissions should be obtained from the applicable author or publisher of the image.
Full text @ Bioarchitecture