
|
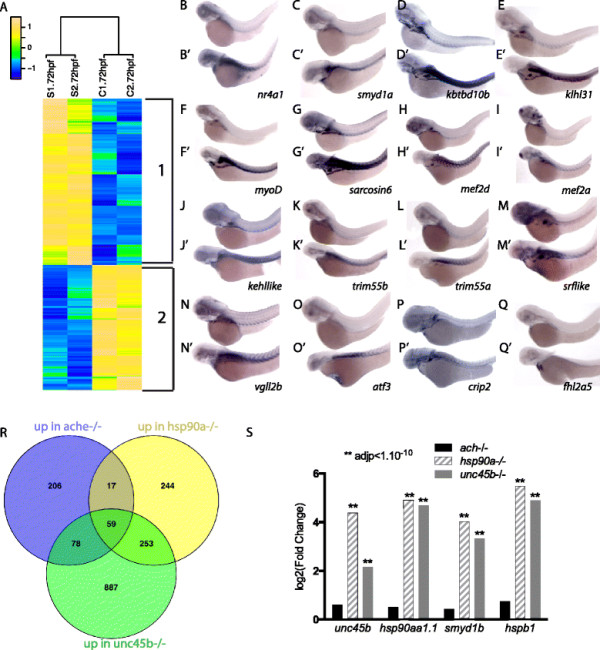
Fig. 2
Transcriptome analysis of unc45b mutants. a Hierarchical clustering of genes significantly up-regulated (yellow) or down-regulated (blue) (fold change of at least 1.5-fold, p adj < 0.05) in two independent mRNA samples from unc45b -/- embryos (S1 and S2) relative to two mRNA preparations from wild-type siblings (C1 and C2) at 72 hpf. The relative expression scale is indicated as normalized expression. Both up-regulated genes (851 genes, cluster 1) and down-regulated genes (560 genes, cluster 2) are shown. The relative expression scale is indicated as normalized expression (blue indicates low expression, green moderate expression, and yellow high expression). b–q′ RNA in situ hybridization to verify RNAseq data. Genes targeted by the antisense probes are indicated in the panels: wild-type siblings (b–q), unc45b mutant embryos (b′–q′). All embryos are 72 h old. Anterior left, dorsal up. r Venn diagram of the genes upregulated in ache, para or unc45b mutants at 72 hpf. Note that in this case DESeq2 was used for the detection of up-regulated genes in order to increase the power of the differential expression analysis. s Log2 fold change of unc45b, hsp90a, smyd1b and hspb1 obtained by RNAseq in 72-hpf ache-/-, unc45b-/- and hsp90a-/-. Asterisks above the bars indicate significant adjusted p values (adjp)