
IMAGE
Fig. 6
Image
|
Figure Caption
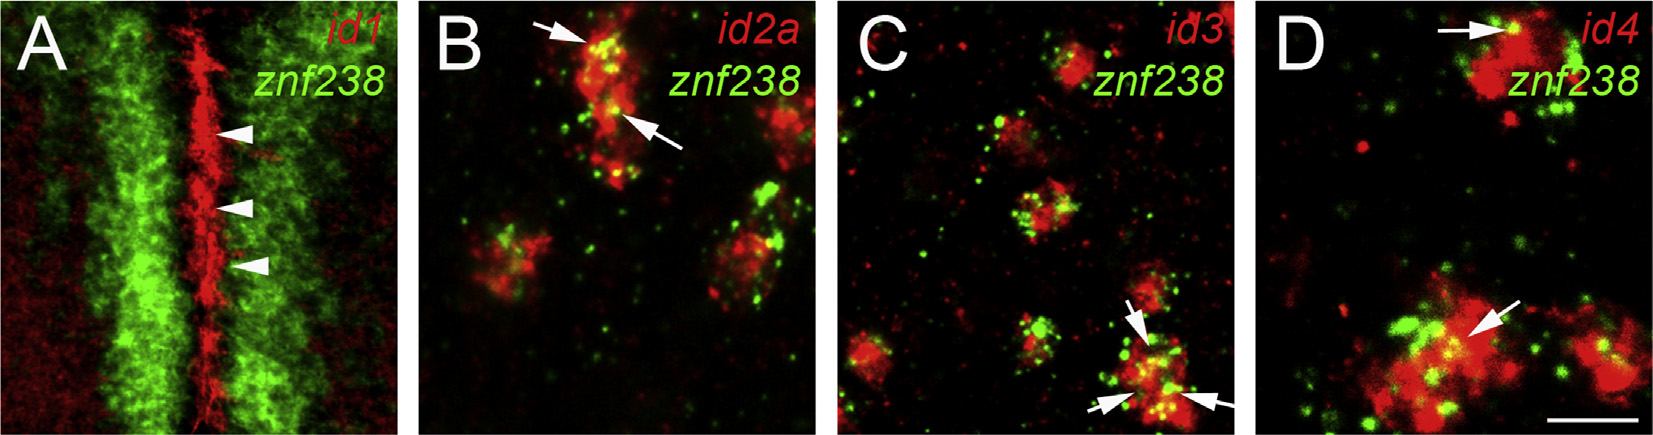
Fig. 6 id2a, id3 and id4 are expressed in znf238-positive cells, but not id1. A to D: Double fluorescent in situ hybridization in the pallium showing id1, id2a, id3 and id4 transcripts in red and znf238 mRNA in green. Id1 transcripts are not detected in znf238 expressing cells (arrowheads), while id2a, id3 and id4 transcripts are expressed in znf238 positive cells (arrows). Scale bar: 6 µm (D); 12 µm (B to C); 35 µm (A).
Figure Data
Acknowledgments
This image is the copyrighted work of the attributed author or publisher, and
ZFIN has permission only to display this image to its users.
Additional permissions should be obtained from the applicable author or publisher of the image.
Reprinted from Gene expression patterns : GEP, 19(1-2), Diotel, N., Beil, T., Strähle, U., Rastegar, S., Differential expression of id genes and their potential regulator znf238 in zebrafish adult neural progenitor cells and neurons suggests distinct functions in adult neurogenesis, 1-13, Copyright (2015) with permission from Elsevier. Full text @ Gene Expr. Patterns