
Image
|
Figure Caption
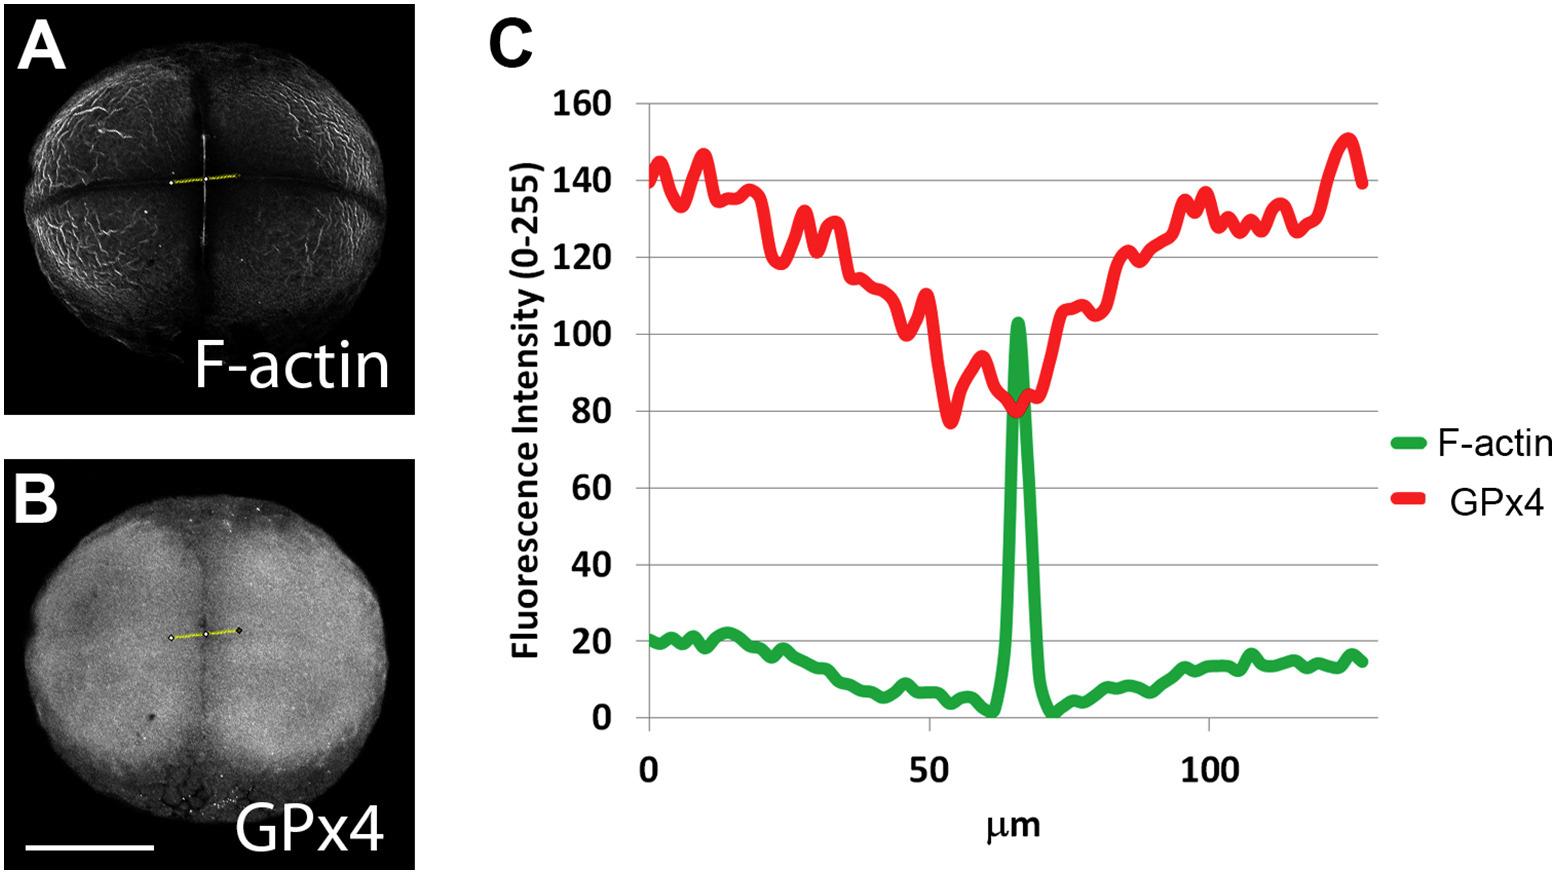
Fig. S4 GPx4 protein is located at the blastomeres and is less abundant at the cleavage furrow (B), where important F-actin accumulation is found (A). Relative fluorescence intensity was determined by the gray scale pixel values along a line indicated in yellow (A and B) and plotted in the graph (C). Scale bar 250 µm.
Acknowledgments
This image is the copyrighted work of the attributed author or publisher, and
ZFIN has permission only to display this image to its users.
Additional permissions should be obtained from the applicable author or publisher of the image.
Reprinted from Gene expression patterns : GEP, 19(1-2), Mendieta-Serrano, M.A., Schnabel-Peraza, D., Lomelí, H., Salas-Vidal, E., Spatial and temporal expression of zebrafish glutathione peroxidase 4 a and b genes during early embryo development, 98-107, Copyright (2015) with permission from Elsevier. Full text @ Gene Expr. Patterns