
|
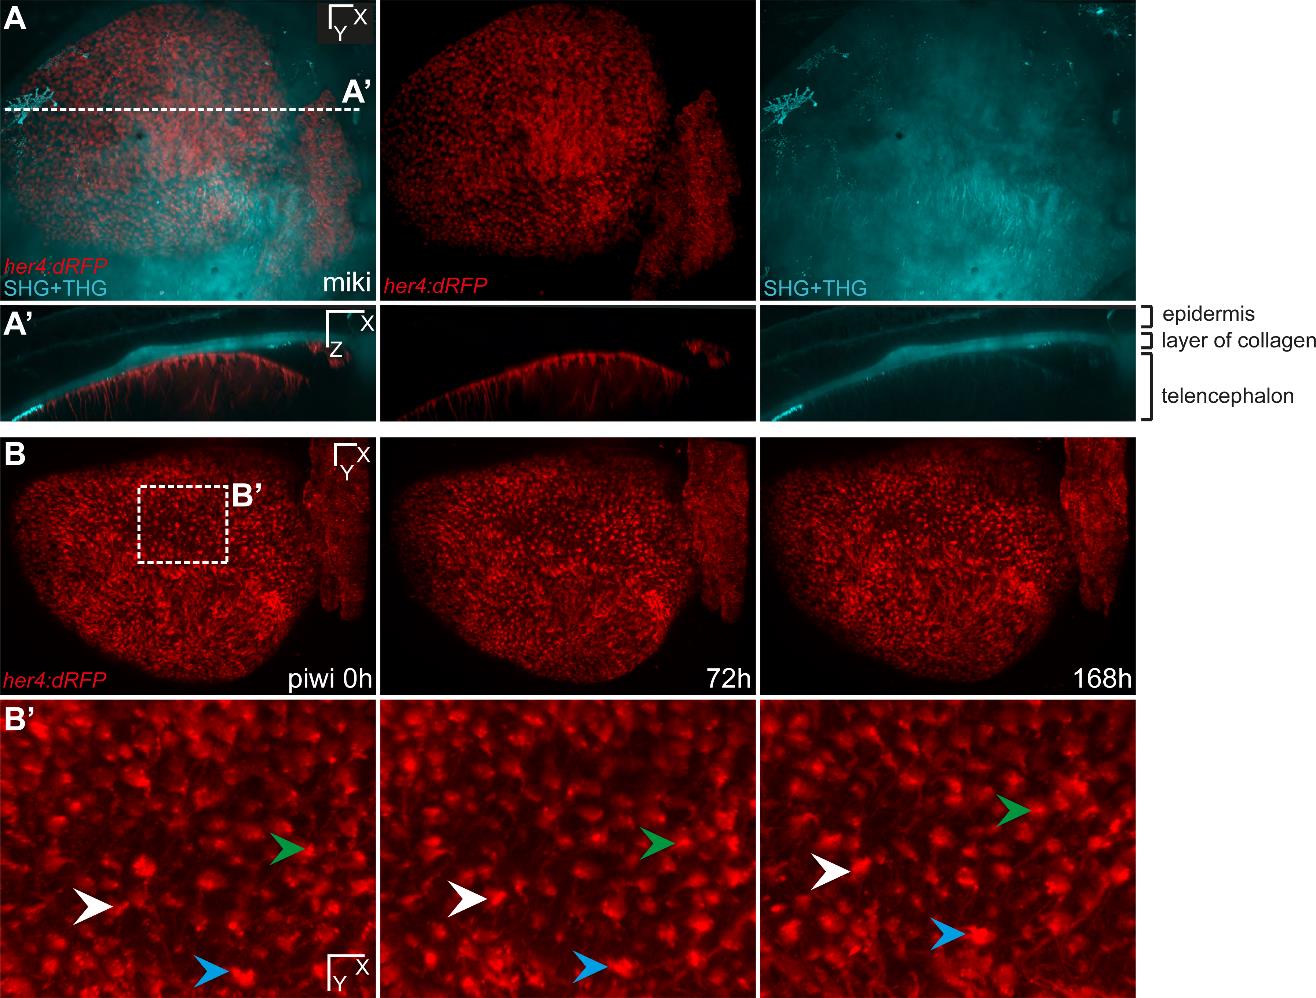
Fig. S5 Alignment of successive z-stacks using SHG/THG signals. (A,A′) Dorsal and transversal views respectively for one time point of a transgenic zebrafish her4:dRFP into a casper background (individual fish named miki). The red channel is showing all the glial cells expressing Her4 and their processes are visible (A′). One entire hemisphere can be imaged using the 20X objective such as in (A) or two halves of each hemisphere such as in Supplementary material Fig. S3. (B,B′) Three time points of a transgenic her4:dRFP named piwi. The time points were aligned using the SHG/THG signals only (not shown here) and the RecursuveReg Imaris extension. (B′) is showing a high magnification of (B) and the three arrowheads are pointing to the same three cells over 168 hours showing that the alignment almost perfectly corrects the changes in orientation when the fish is repeatedly mounted (see also Supplementary material Movie 4).
Scale bars, 50 µm (A-B), 20 µm (B′).