
|
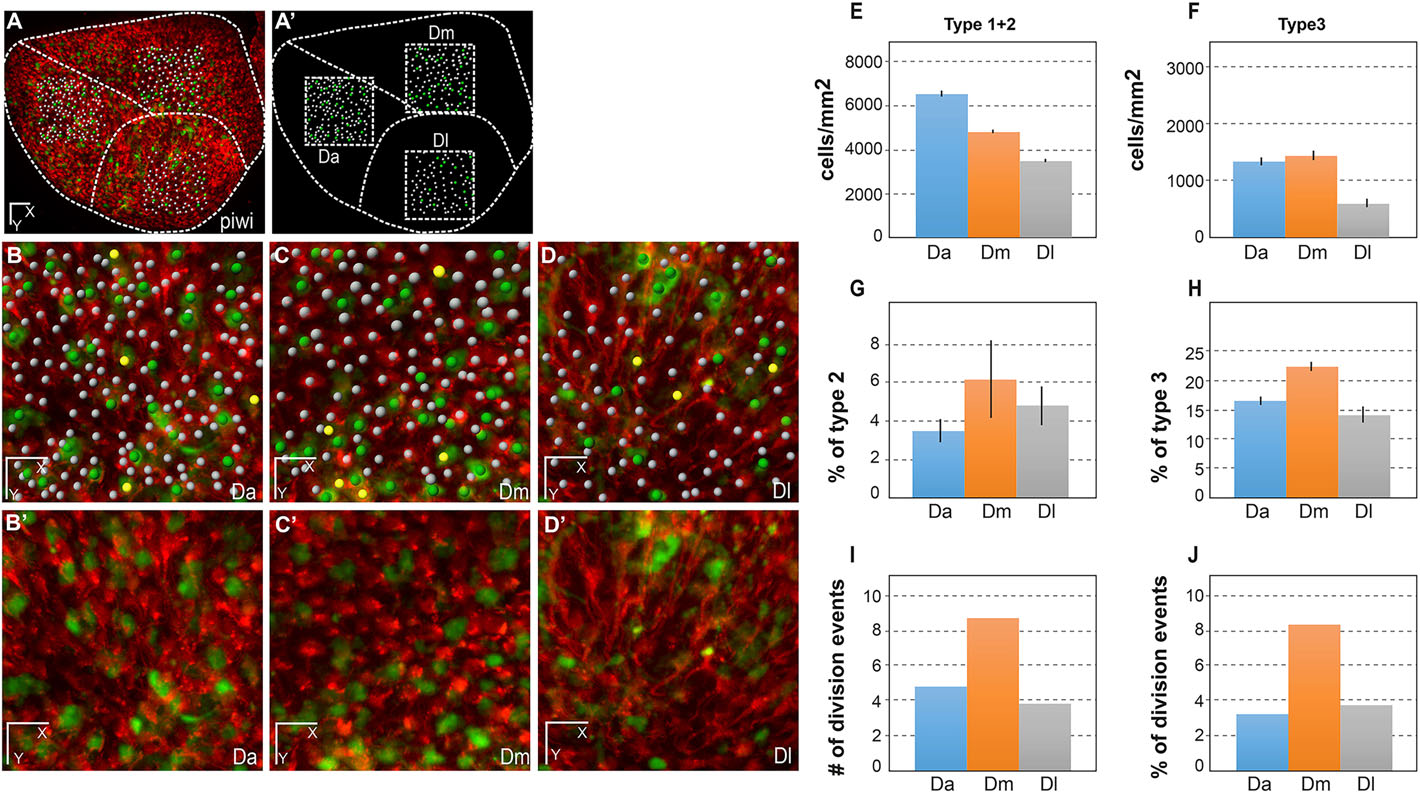
Fig. 3
Quantitative analysis of dynamic NSC parameters in distinct domains of the pallial germinal zone (Da, Dm and Dl) in the fish named piwi. (A,A′) Live image of the pallial germinal zone showing her4:drfp-positive NSCs (red) and mcm5:egfp dividing cells (green) (A) and positioning of the three sampled subdomains (dashed squares representing a top view of the sampled cubes) (A′). Dashed lines separate the corresponding neuroanatomical domains. Anterior to the left, midline to the top. Da, anterior pallium; Dm, medial pallium; Dl, lateral pallium. Adapted from Wullimann et al. (1996). (B-D′) High magnification views of the three domains, as indicated, with (B-D) and without (B′-D′) individual cell plotting. White dots, quiescent NSCs; yellow dots, activated NSCs; green dots, dividing her4-drfp-negative progenitors. (E-H) Quantification of NSC parameters over 10days (t1-t4). All statistics are paired t-tests, with standard deviations indicated as vertical bars. The average numbers of NSCs counted for each domain per time point are 151 (Da), 109 (Dm) and 83 (Dl). (E) NSC density in each domain, measured as the total number of type 1+type 2 cells per mm2 of germinal zone surface (see Materials and Methods for the calculation of this surface taking into account the germinal zone curvature). Da versus Dm: P<0.001; Da versus Dl: P<0.0001; Dm versus Dl: P<0.0001. (F) Density of type 3 cells (non-glial proliferating progenitors), measured as the total number of type 3 cells per mm2. Da versus Dm: P<0.1; Da versus Dl: P<0.0001; Dm versus Dl: P<0.0001. (G) Proportion of activated NSCs (type 2 cells) in each domain among the total NSC population (type 1+type 2 cells). Da versus Dm: P<0.1; Da versus Dl: P<0.05; Dm versus Dl: not significant. (H) Proportion of type 3 cells among the total progenitor population (type 1+type 2+type 3 cells). Da versus Dm: P<0.001; Da versus Dl: P<0.05; Dm versus Dl: P<0.01. (I,J) Quantification of de novo NSC activation events over 7days (t2-t4) in absolute numbers (I) and in proportion of the number of RG quiescent at time t4 (J). Da versus Dm: P=0.1 (not quite significant); Da versus Dl: P=0.7, not significant; Dm versus Dl: P=0.5 (not significant); Fisher′s two-tailed test. Scale bars: 50µm (A,A′), 30µm (B-D′).