
|
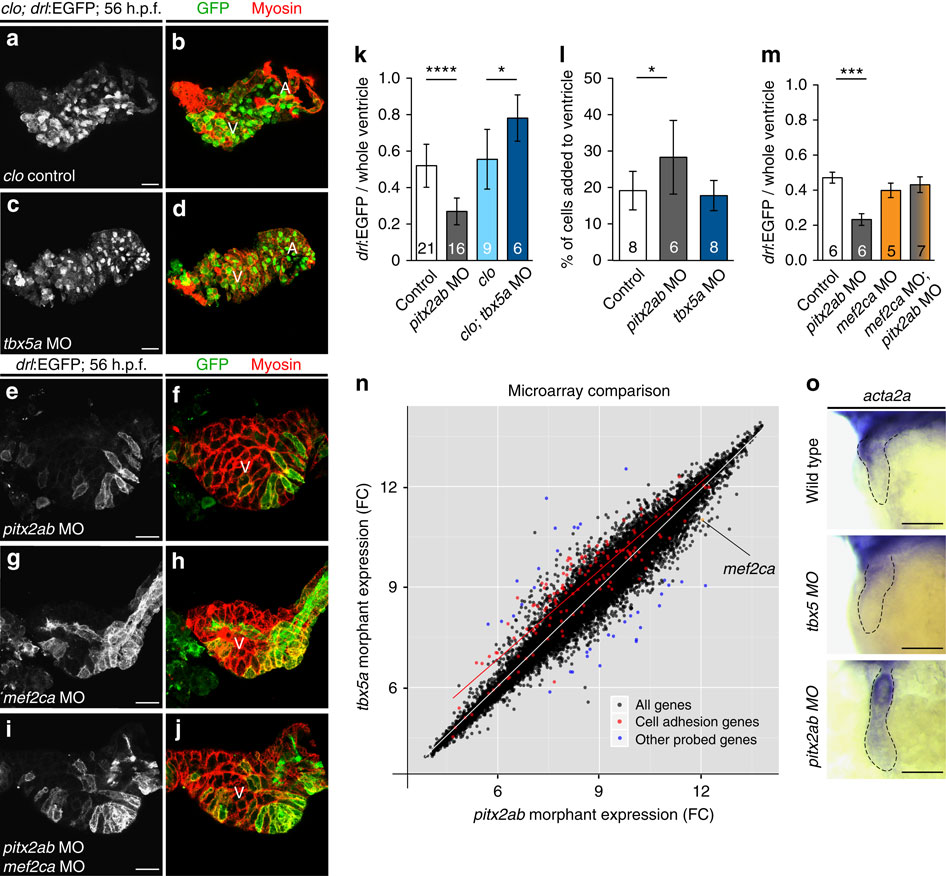
Fig. 4
tbx5a and pitx2ab affect the relative contribution of FHF versus SHF to the heart tube.
(a–j) Top-down 2-µm confocal sections through zebrafish 54–56 h.p.f. hearts; scale bar, 20 µm. (a–d) Hearts mutant for cloche (clo) to enable imaging of myocardium without endocardial and erythrocyte signal in drl:EGFP transgenics, stained for EGFP expression from drl:EGFP (green, monochrome channel image in right column) and myosin/MF20 (red); (a,b) cloche-only control, (c,d) morpholino knockdown of tbx5a leads to expansion of FHF. (e,f) Loss of pitx2ab results in diminishing of FHF and expansion of SHF. (g–j) Genetic interplay of mef2ca with pitx2ab on FHF versus SHF contribution in wild-type hearts. (g,h) Loss of mef2ca leads to only mild reduction of FHF contribution. (i,j) Concomitant loss of mef2ca and pitx2ab reverts the pitx2ab morpholino (MO)-mediated impact on FHF formation. (k) Graph displaying the ratio of FHF area labelled by drl:EGFP expression to the whole ventricular area determined by anti-myosin staining in hearts from experiments represented in a–f. (l) Graph showing percentage of newly added cardiomyocytes to the ventricle after photoconversion of myl7:nlsKikGR at 27 h.p.f. and imaged at 56 h.p.f. (see also Supplementary Fig. 6). (m) Graph showing the restoration of the FHF area labelled by drl:EGFP expression to the whole ventricular area determined by anti-myosin staining in hearts with combined loss of pitx2ab and mef2ca comparing with the single morphant or control hearts. Error bars in k–m=s.d., asterisks indicate significance, significance tested by two-tailed unpaired t-test, P<0.05. (n) At 54–56 hpf, whole-embryo microarray comparison of tbx5a versus pitx2ab knockdown reveals cell adhesion genes significantly deregulated (red dots); note the upregulation of the SHF regulator mef2ca on pitx2ab knockdown (orange dot). (o) mRNA in situ hybridization of acta2a as representative deregulated gene at 52–56 h.p.f.; closeups of heart regions, anterior to the left, in indicated conditions, dotted outlines indicate heart tube; scale bar, 100 µm (see alsoSupplementary Fig. 8 for more examples).