
Image
|
Figure Caption
Fig. S3
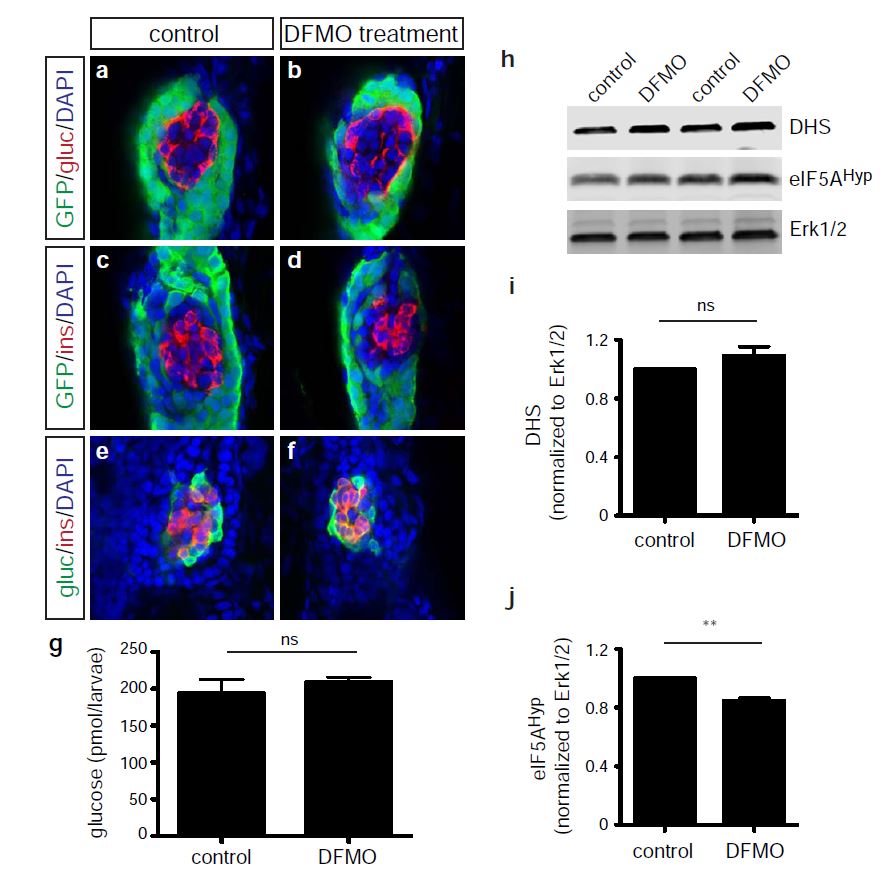
Endocrine cell phenotype following the inhibition of polyamine biosynthesis by DFMO treatment.
Representative images at 72 hps of glucagon-expressing cells in (a) control and (b) DFMOtreated Tg(ptf1a:gfp) embryos; insulin-expressing cells in (c) control and (d) DFMO-treated Tg(ptf1a:gfp) embryos; and insulin/glucagon co-expressing cells in (e) control and (f) DFMOtreated Tg(ptf1a:gfp) embryos. (g) Glucose measurement from control or DFMO-treated embryos at 72 hpf (n = 3 groups of 10 embryos/group) (p = 0.4821). (h) Western blot analysis for expression of DHS, eIF5AHyp, and Erk1/2 in control and DFMO-treated embryos at 72 hpf (n = 4 groups of 30 embryos/group); Erk1/2 was used as a loading control, as expression of this protein is not altered with DFMO treatment. Quantification showed no change in (i) DHS expression (p = 0.2370) but a significant decrease in (j) eIF5AHyp expression (p = 0.0039). gluc, glucagon; ins, insulin. * p < 0.05, ** p < 0.01, *** p < 0.001; ns, not significant.
Acknowledgments
This image is the copyrighted work of the attributed author or publisher, and
ZFIN has permission only to display this image to its users.
Additional permissions should be obtained from the applicable author or publisher of the image.
Full text @ Sci. Rep.