
|
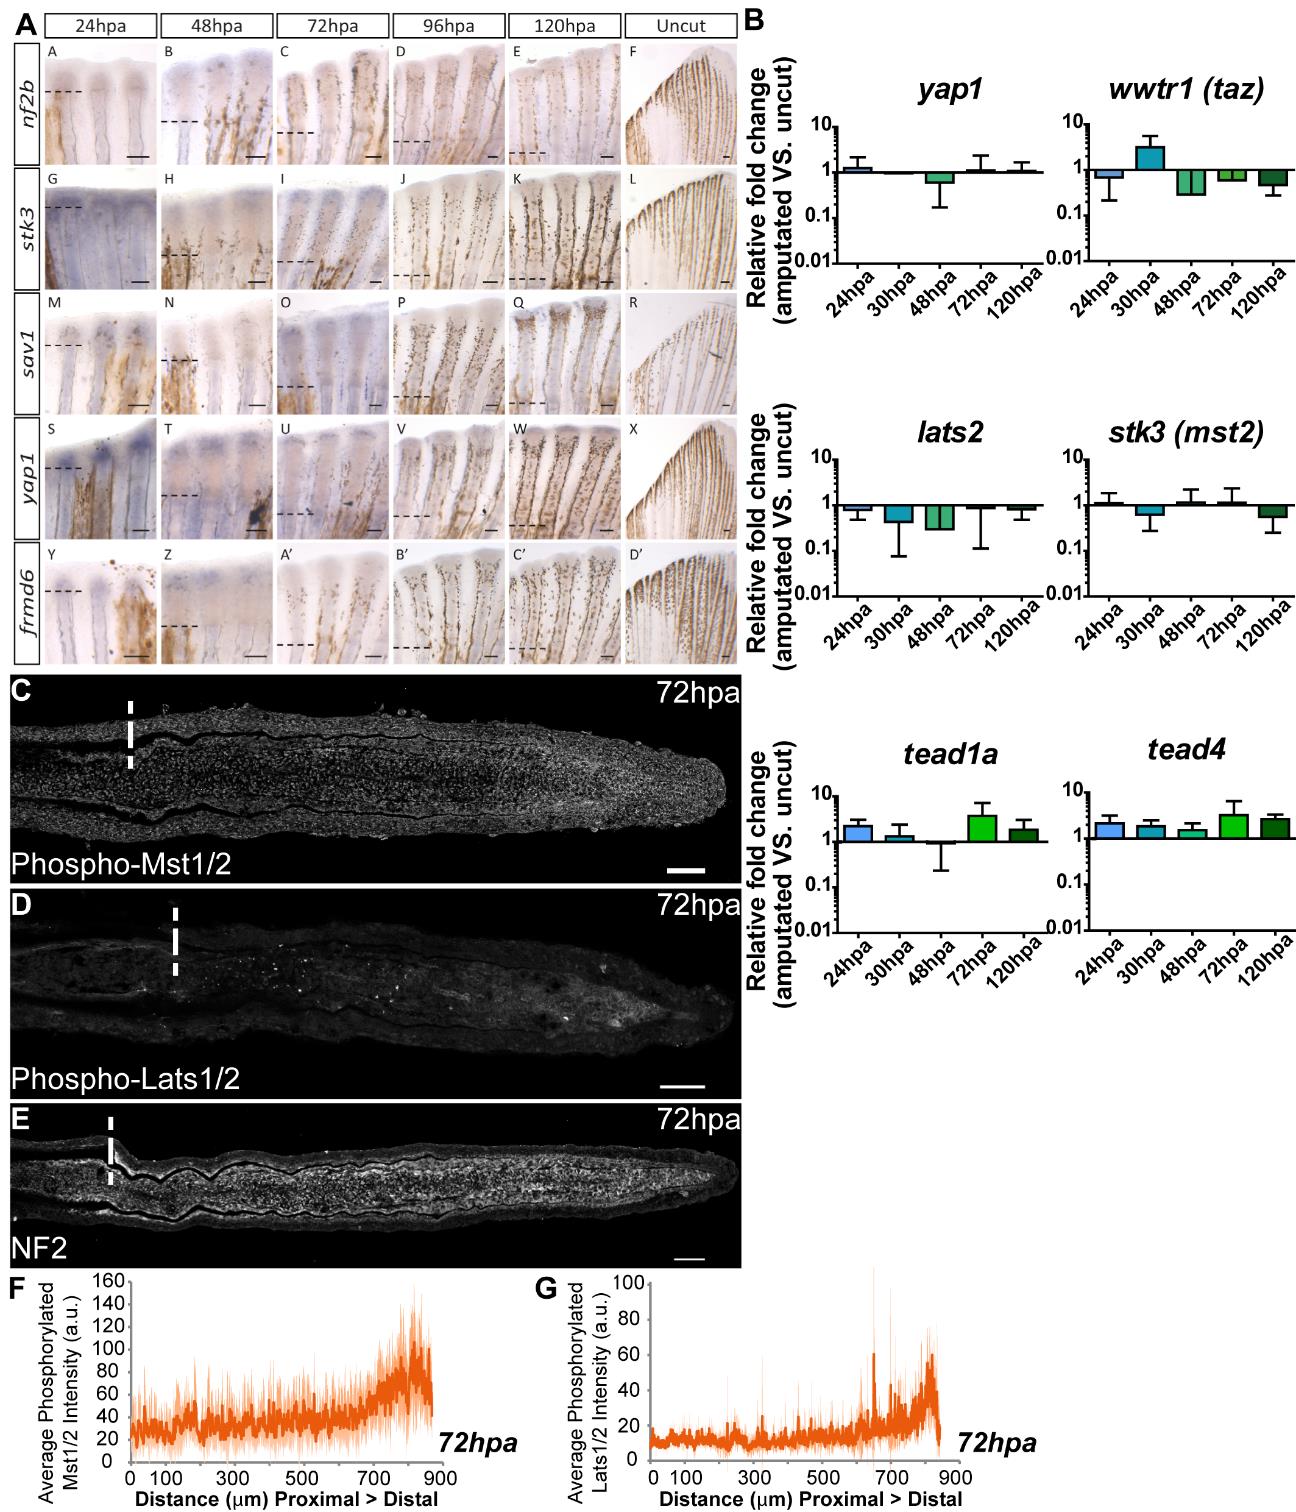
Fig. S1 Hippo pathway components are present during zebrafish caudal fin regeneration. Related to Fig 1. A Representative in situ hybridizations for nf2b, stk3 (mst2), sav1, yap1 and frmd6 (expanded) at 24 hpa, 48hpa, 72 hpa, 96 hpa, 120 hpa and uncut fins. n=3 fins per condition. Scale bars correspond to 100µm. B qPCR determination of yap1, wwtr1 (taz), lats2, stk3 (mst2), tead1a and tead4 relative expression levels during several regenerative stages (24 hpa, 30 hpa, 48 hpa, 72 hpa and 120 hpa) versus uncut controls. Logarithmic scale, base 10. C-E Representative immunofluorescence images against phosphorylated Mst 1/2 (C), phosphorylated Lats 1/2 (D) and total NF2 (E) in 72 hpa blastemas. F-G Quantification of average phospho-Mst 1/2 (F) and phospho-Lats 1/2 (G) intensity (in arbitrary units, a.u.) in mesenchymal cells along the PD axis (µm) of blastemas at 72 hpa. n=5 sections, 3 fish per condition. Shadows indicate the standard deviation of the mean for each curve. For all measurements, areas from the medial blastema were considered. Dashed lines indicate amputation plane. Scale bars correspond to 50µm.