
|
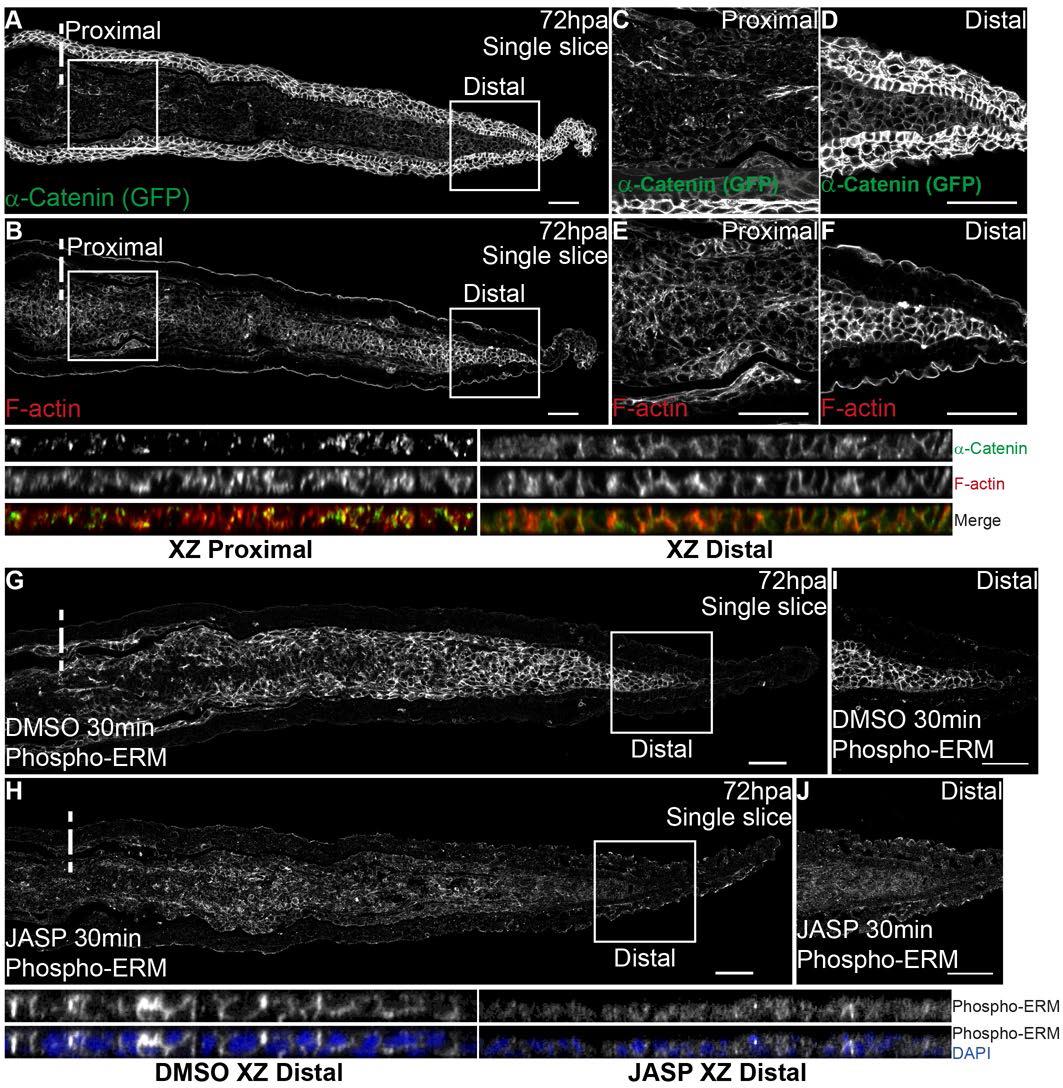
Fig. S7 α-Catenin and F-actin partially co-localize in the regenerating blastema. Related to Fig 6. A,B Representative immunofluorescence with anti-GFP and phalloidin (F-actin) in 72 hpa longitudinal sections of α-Catenin transgenics. A Representative single frame of α-Catenin; (B) Corresponding single frame of F-actin. C-F Corresponding zoomed areas represented by squares in A-B. Proximal (C) and distal (D) zoomed images from A showing the differential α- Catenin expression along the PD axis. Corresponding proximal (E) and distal (F) zoomed images from B showing the differential F-actin expression along the PD axis. Single color and merged XZ projections of proximal blastema images C,E and distal blastema images D,F are shown below the corresponding panel to highlight intracellular localization. n=9 sections, 3 fish. G-H Representative immunofluorescence with anti-Phospho-ERM (representing F-actin) in 72 hpa longitudinal sections of animals injected with Jasplakinolide (JASP) and respective DMSO controls. Phospho-ERM expression in DMSO (G) and JASP (H) animals. I-J Zoomed areas represented by squares in G-H, showing Phospho-ERM expression in the distal blastema of DMSO (I) and JASP (J) animals. Corresponding XZ projections of distal blastema images I-J are shown to highlight intracellular localization in both situations; single color images showing Phospho-ERM expression and merged with DAPI. Intraperitoneal injections were performed in 72 hpa animals, 30 minutes pre-fixation of the caudal fins. n=8 sections, 4 fish per condition. Dashed lines indicate amputation plane. Scale bars correspond to 50µm.