
Image
|
Figure Caption
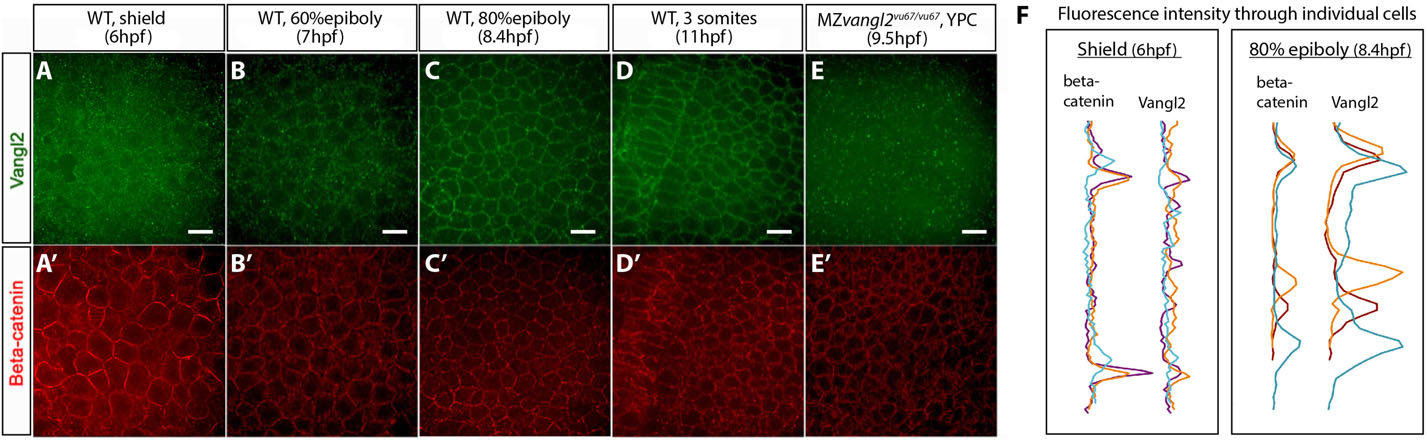
Fig. 3
Dynamic Vangl2 intracellular localization during gastrulation. (A-E′) Confocal images of WT embryos showing the intracellular and membrane localization of Vangl2 (A-E) and β-catenin (A′-E′). (F) Quantification of Vangl2 and β-catenin fluorescence intensity in individual cells (three independent cells shown in lines of different color) at 6hpf and 8.4hpf, obtained using the Plot Profile tool (Fiji) through the length of the cell. Peaks correspond to cell membrane. Scale bars: 20µm.
Acknowledgments
This image is the copyrighted work of the attributed author or publisher, and
ZFIN has permission only to display this image to its users.
Additional permissions should be obtained from the applicable author or publisher of the image.
Full text @ Development