
|
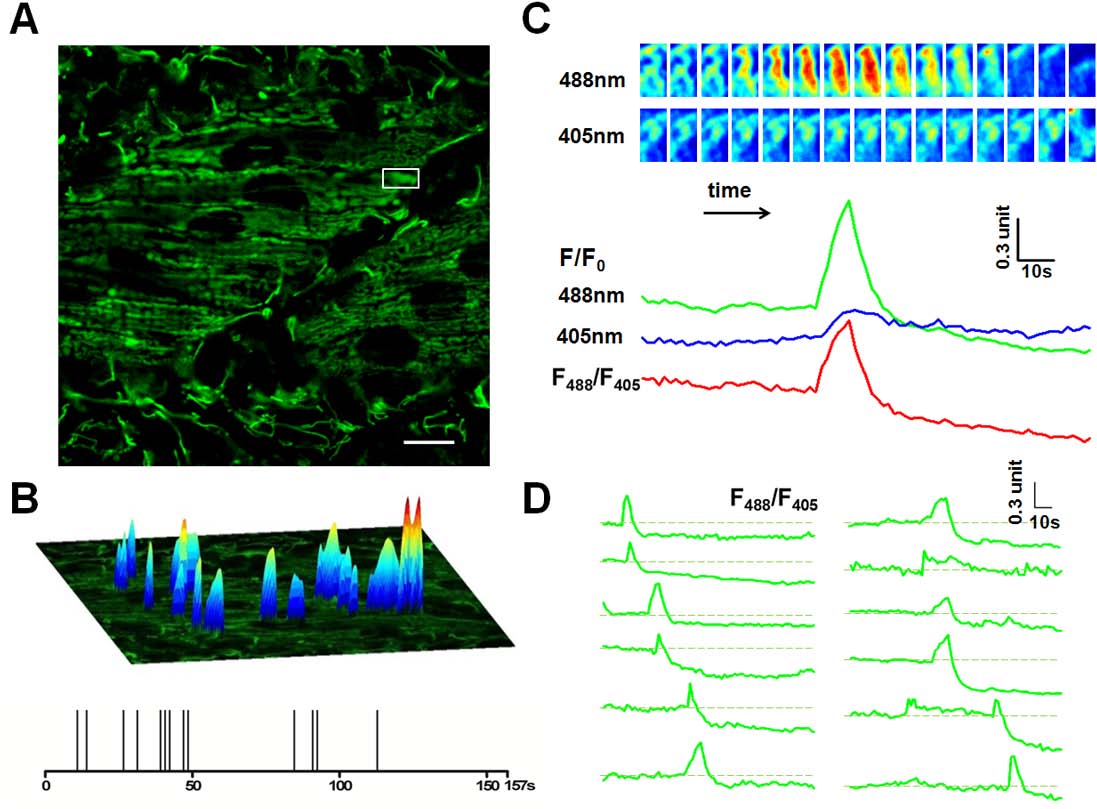
Fig. 2
Mitoflash activities in red skeletal muscles of 2 dpf zebrafish embryos.
(A). Time-lapse recording of mitoflashes in red skeletal muscles of a mt-cpYFP transgenic embryo. Scale bar, 10 µm. See S1 Movie. (B) Amplitudes, spatial and temporal distribution of the mitoflash signals occurring during a 157-s recording period. The spikes in the temporal diary in the lower panel just reflect the temporal distribution of the mitoflashes, so they are of the same height. The upper surface plots overlaying the mitochondria image mainly indicate the spatial location, intensity and spatial morphology of mitoflashes. Their height is defined according to respective mitoflash peak amplitude ΔF/F0, instead of the background intensity. (C) Time course of a representative mitoflash from the boxed region in panel A. Upper panel: time sequence of the mitoflash seen alternatively at 488 nm and 405 nm excitation. Lower panel: line plots of normalized cpYFP signals (F/F0) under 488 nm and 405 nm excitation and their ratio (F488/F405), the latter removes motion artifacts associated with mitochondrial swelling. (D) Diverse morphology of mitoflashes of the same skeletal muscle. The traces were arranged by the start points of the major mitoflash event seen in a single trace. Photobleaching (~10%) was corrected based on global intensity decay and the dashed lines mark the basal level. Traces of the last 31 s are not shown due to motion artifacts caused by muscle twitch (see S1 Movie).