
|
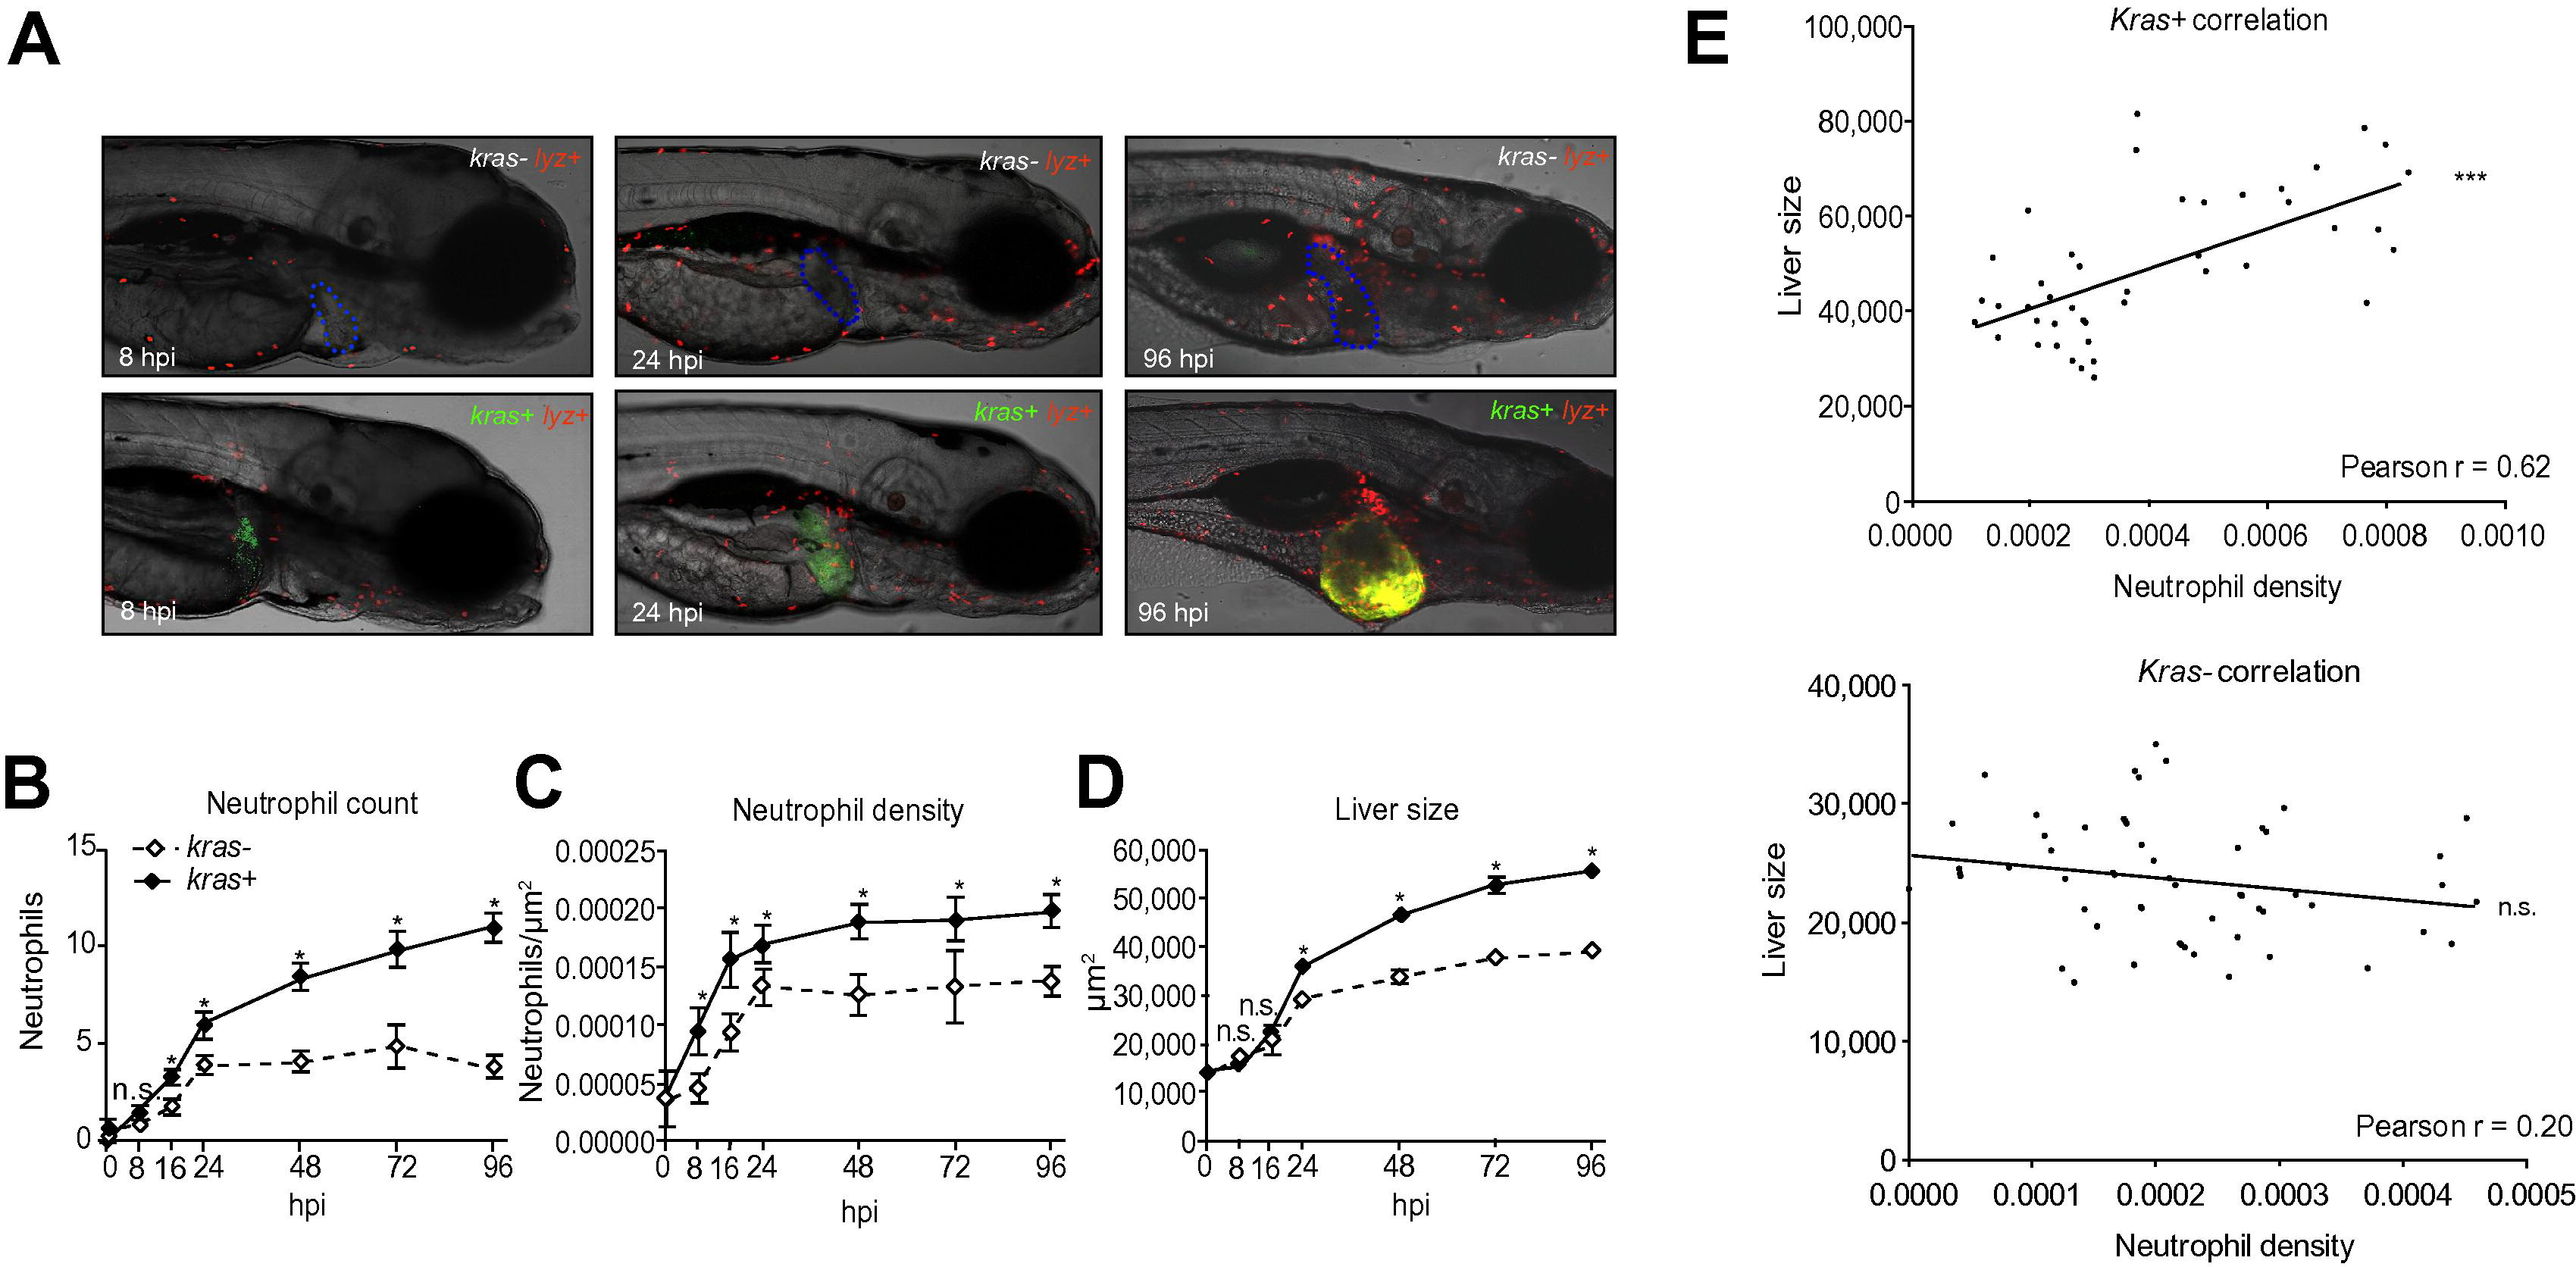
Fig. 1
Recruitment of neutrophils to oncogenic liver. (A) Representative images of kras-/lyz+ and kras+/lyz+ larvae after 8, 24, and 96 hours of doxycycline induction starting from 3 dpf. The livers are outlined in blue dash lines in the upper images of kras-/lyz+ larvae and marked by GFP expression in the lower images of kras+/lyz+ larvae. (B–D) Time course of neutrophil count (B), neutrophil density (C) and liver size (D) following induction of oncogenic krasV12 expression in hepatocytes (n >15 from each group). Neutrophils were counted in the liver area and normalized against the liver size for liver density. Liver size was measured based on 2D images. (E) Correlation of liver size and neutrophil density in the liver. The measurements were based on 8 dpf larvae after 5 days of doxycycline induction. A positive correlation was observed only in the kras+ transgenic larvae (top) but not in the kras control group (bottom). Statistical significance: *p <0.05, **p <0.01, ***p <0.001.
Reprinted from Journal of hepatology, 63(2), Yan, C., Huo, X., Wang, S., Feng, Y., Gong, Z., Stimulation of hepatocarcinogenesis by neutrophils upon induction of oncogenic kras expression in transgenic zebrafish, 420-8, Copyright (2015) with permission from Elsevier. Full text @ J. Hepatol.