
|
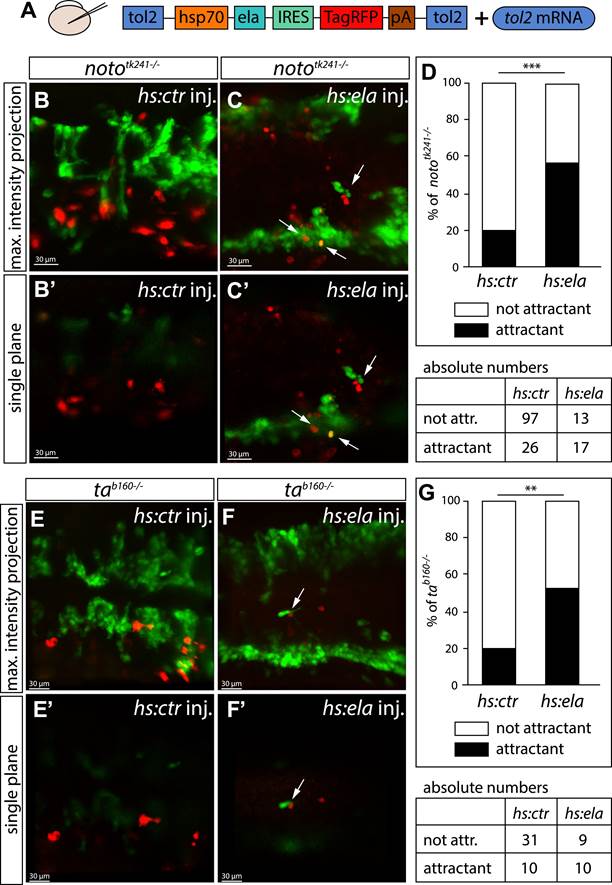
Fig. 4 Ela overexpressing cells attract angioblasts.
(A) F1 embryos from nototk241+/ or tab160+/ parents were injected with 250 pg Tol2 mRNA as well as 10 pg of DNA constructs, in which the heatshock promotor was used to drive either control (ctr, Cherry) or ela expression. Individual Ela overexpressing cells were labeled by IRES mediated RFP expression. Expression was induced by two consecutive heatshocks (incubation at 39°C) at 12 hpf and 14 hpf for 1 hr each. (B–C2) Angioblast migration in nototk241/ mutant embryos injected with the ctr (B, B2) or the ela overexpression (C, C2) construct. (D) Quantification of Ela/RFP or ctr (Cherry) positive cells showed significantly more Ela overexpressing cells attracting angioblasts than ctr cells (n = 10 embryos for hs:ela, n = 20 embryos for hs:ctr ; p*** = 0.0001). (E–F2) Angioblast migration in tab160 / mutant embryos injected with the ctr (E, E2) or the ela overexpression (F, F2) construct (G) Quantification of Ela/RFP or ctr (Cherry) positive cells showed significantly more Ela overexpressing cells attracting angioblasts than ctr cells (n = 8 embryos for hs:ela, n = 10 embryos for hs:ctr ; p** = 0.0089). Significance was calculated by chi-square test. Maximum intensity projections give an overview of the analyzed embryos. Single planes visualize the closeness of Ela or ctr (Cherry) expressing cells to angioblasts. White arrows point to Ela overexpressing cells with less than 5 µm distance to angioblasts. <5 µm distance between an Ela/ctr positive cell and an angioblast was counted as ‘attractant’; 5–40 µm distance was counted as ‘not attractant’. Scale bars represent 30 µm.