
Image
|
Figure Caption
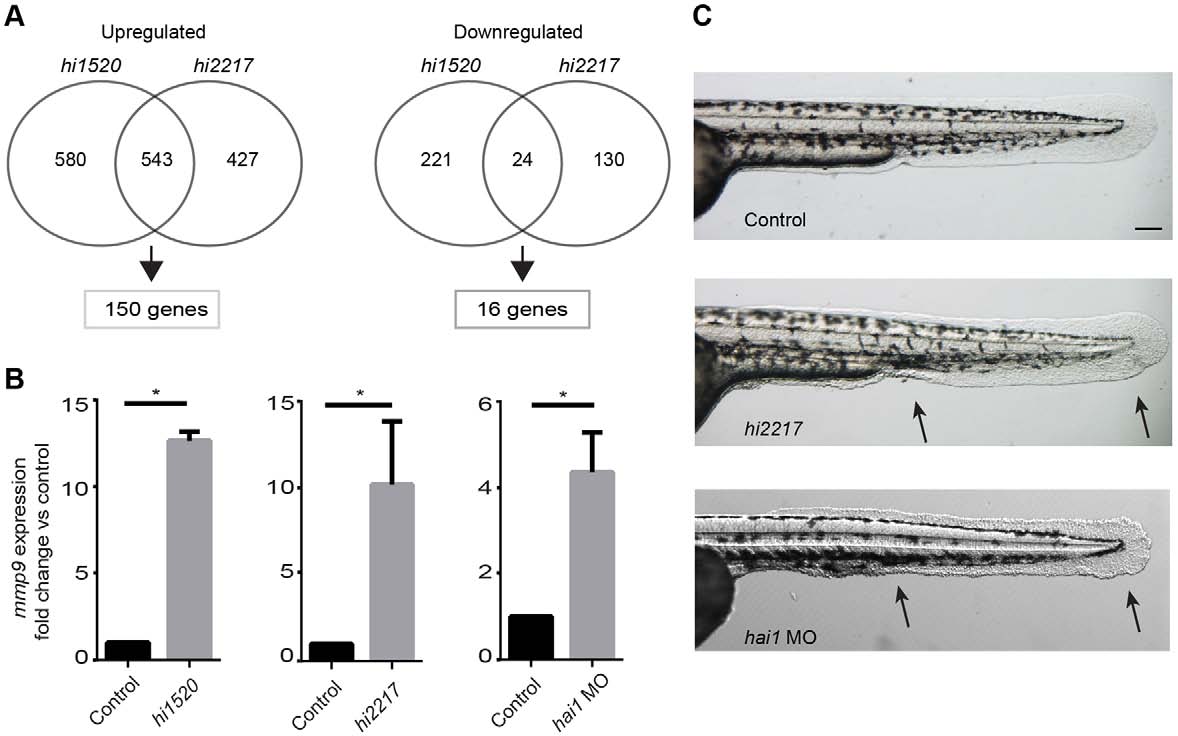
Fig. 1
Gene expression profiling reveals elevated inflammatory gene expression, including mmp9, in chronic inflammation mutants. (A) Microarray analysis of inflammation mutants, hi1520 and hi2217, revealed overlapping upregulation of 150 genes and downregulation of 16 genes compared with WT siblings. (B) Upregulation of mmp9 was confirmed by qRT-PCR in the hi2217 and hi1520 mutants and the hai1 morphants. (C) The mutants are characterized by epithelial extrusions and abnormal epithelium development (arrows). Data pooled from experiments performed in triplicate. *P<0.05. Scale bar: 200 µm.
Figure Data
Acknowledgments
This image is the copyrighted work of the attributed author or publisher, and
ZFIN has permission only to display this image to its users.
Additional permissions should be obtained from the applicable author or publisher of the image.
Full text @ Development