
|
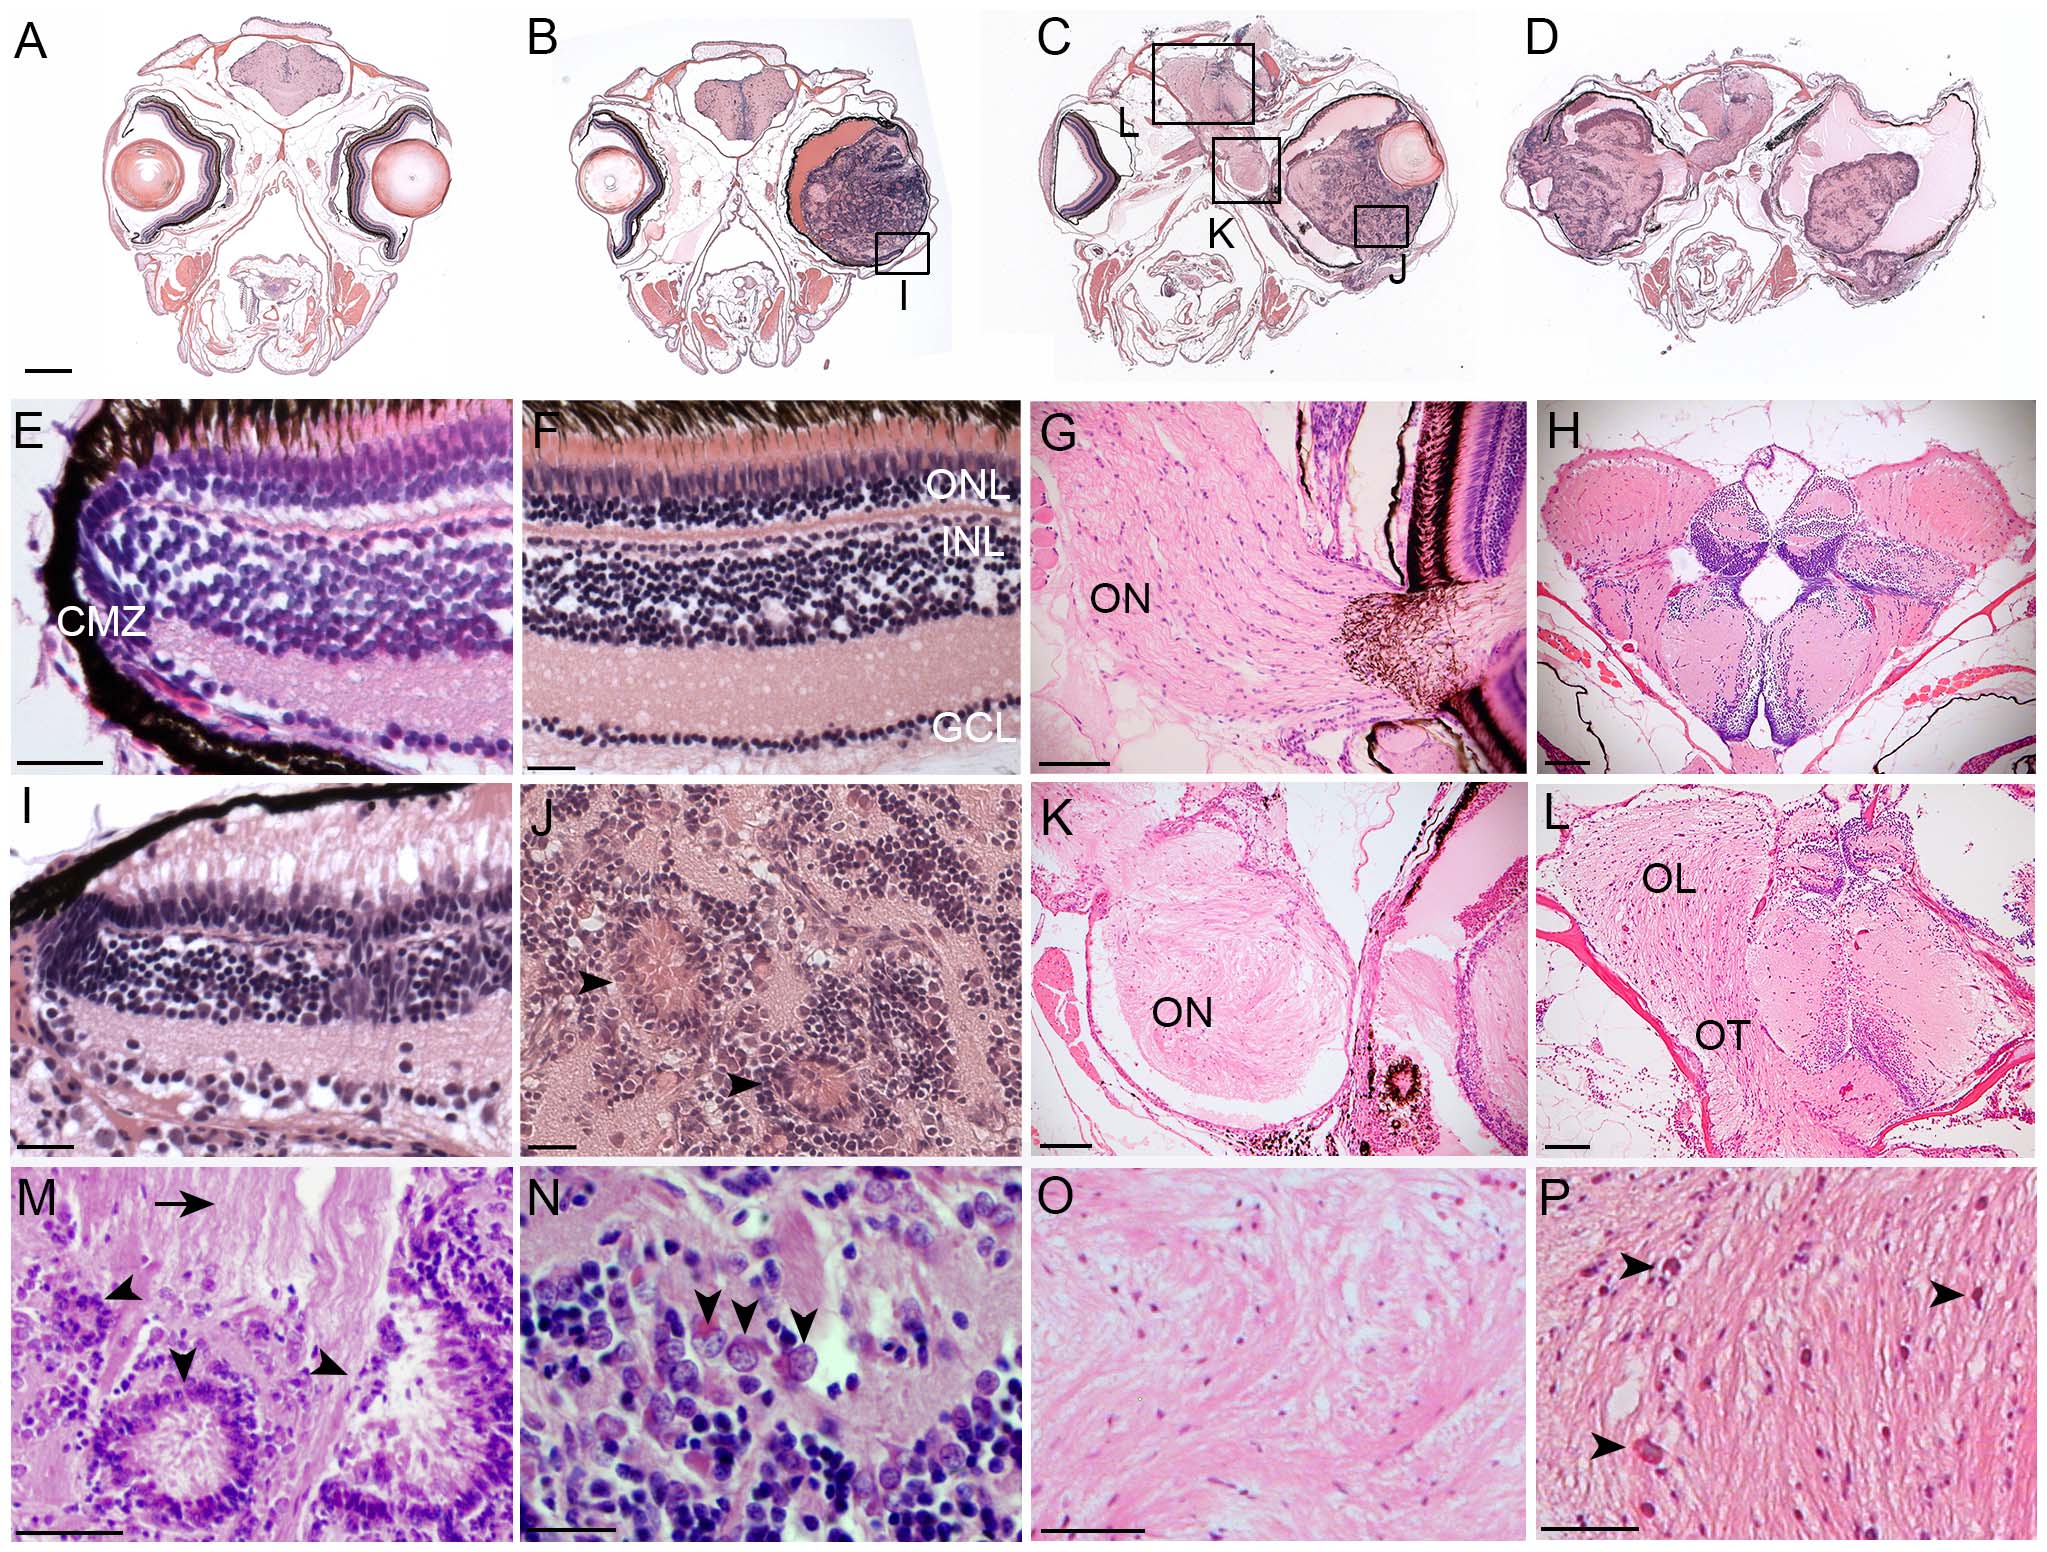
Fig. 3 Histological analysis of Tg(flk1:RFP)is18 tumors reveals similarities with retinoblastoma and glioma.
Coronal sections through heads of wild type (A, E–H) and Tg(flk1:RFP)is18/+ adults (B–D, I–L). (B) 5-month-old Tg(flk1:RFP)is18/+ adult with retinal tumor filling the vitreous. 1-year-old Tg(flk1:RFP)is18/+ adults with unilateral (C) or bilateral tumors (D). Tumor cells extend through the optic pathway to the tectum. (E,F) Ciliary marginal zone and mature retina in wild type. (G) Fibrillar ribbon-like structure of a wild type optic nerve exiting the eye. (H) Section through forebrain shows the sacus dorsalis and left and right lobes of the anterior region of the optic tectum. (I) Intact ciliary marginal zone in the tumorous retina from Tg(flk1:RFP)is18/+ adult shown in B. Degeneration of the retinal pigment epithelium and photoreceptor outer segments is evident. Disorganization of the retinal layers adjacent to the ciliary marginal zone is present. Streaking across the inner plexiform layer appears similar to reactive Müller glia. (J) Advanced tumors contain rosettes and blood vessels extending throughout the tumor tissue. (K) Disorganization and dysplasia in the optic nerve of the Tg(flk1:RFP)is18/+ adult in C. (L) Brain from the adult in panel D showing dysplasia of the optic tract with infiltration and disruption of normal brain structures. (M) Dysplastic areas of advanced tumor with rosettes of various sizes (arrowheads) and extensive glial fibrillar proliferation (arrow). (N) “Salt and pepper” chromatin dispersion pattern (arrowheads) consistent with a neuroectodermal tumor cell. (O) Disorganization of the optic nerve with absence of organized fibrils. (P) Expansion of the optic lobe with possible areas of necrosis (arrowheads). CMZ, ciliary marginal zone; GCL, ganglion cell layer; INL, inner nuclear layer; OL, optic lobe; ON, optic nerve; ONL, outer nuclear layer; OT, optic tract. Scale bars A, B, C, D 500 µm; E, F, G, I, J, N 20 µm; H, K, L 100 µm; M, O, P 50 µm.