
|
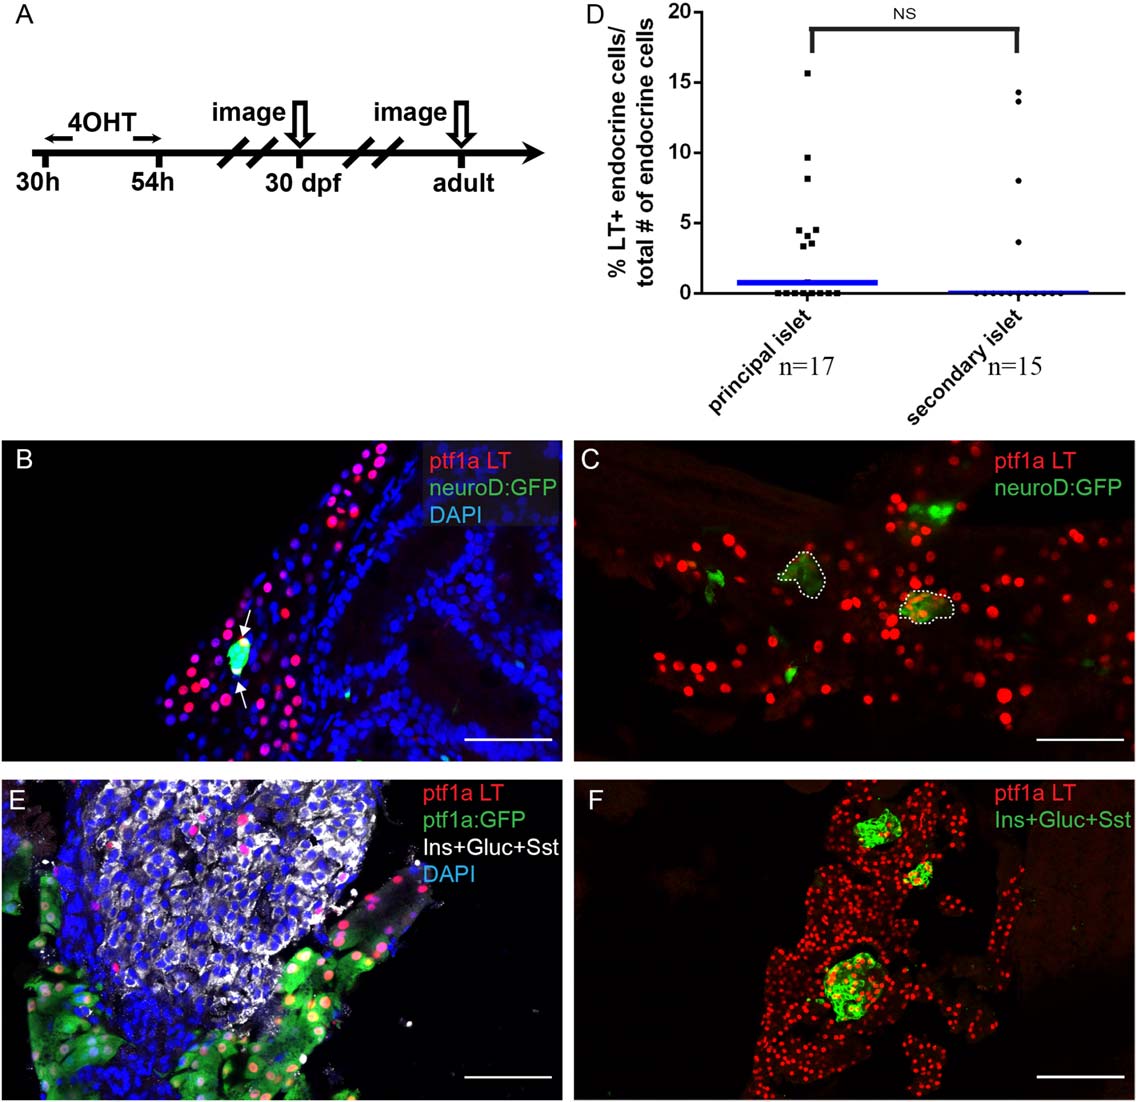
Fig. 3
The early ptf1a lineage contributes to secondary islet and adult endocrine cells. A: Experimental setup. B, C, E, F: The ptf1a lineage is labeled by nuclear-mCherry (red). B, C: Sections from 30-dpf juvenile lineage-tracing fish. The secondary islet is labeled by the transgenic marker neuroD:GFP (green). B: Arrows point to endocrine cells expressing the ptf1a lineage mark. Notice that not all nuclei within the secondary islet are colabeled by the ptf1a lineage mark. DAPI, blue. C: Secondary islets are labeled by neuroD:GFP (green) and outlined. The secondary islets consist of a clusters of ptf1a lineage–labeled cells. D: Scatter plot shows frequency of ptf1a lineage–labeled cells traced into principal or secondary islets. T-test shows no significance. Blue bars show population median. “n” indicates the number of slides quantified for each population. E, F: Sections from adult lineage-tracing fish. The endocrine population is labeled by a mixture of antibodies against Insulin (Ins), Glucagon (Gluc), and Somatostatin (Sst). E: Some of the endocrine cells express the ptf1a lineage label. The majority of ptf1a lineage–labeled cells co-express ptf1a:GFP transgene (acinar marker). F: Selected islets consist of a cluster of ptf1a-lineage labeled cells. DAPI, blue. Scale bar = 50 µm.