
|
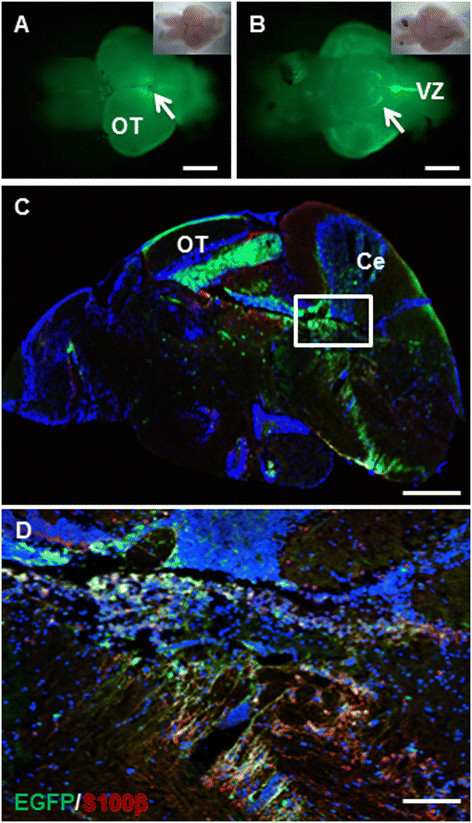
Fig. 1
Expression pattern ofTg(krt5:EGFP)in the adult zebrafish brain. (A) Dorsal view (anterior to the left) of a 6-month-old transgenic fish brain showing EGFP expression in the ventricular zone (VZ) of the midbrain and hindbrain (arrow). Inset shows the bright-field view of the same brain. (B) Ventral view (anterior to the left) of the same brain as in (A) showing EGFP expression in the lobus inferior (LI) of the hypothalamus (arrow) and VZ of the hindbrain. (C) A sagittal section through the adult brain showing EGFP expression in the optic tectum (OT), cerebellum (Ce), and VZ. (D) Enlarged view of framed area in (C) showing overlapping EGFP expression and antibody staining for the radial glia marker S100β (red). Scale bars, 200 µm for A-C; 20 µm for D.