
Image
|
Figure Caption
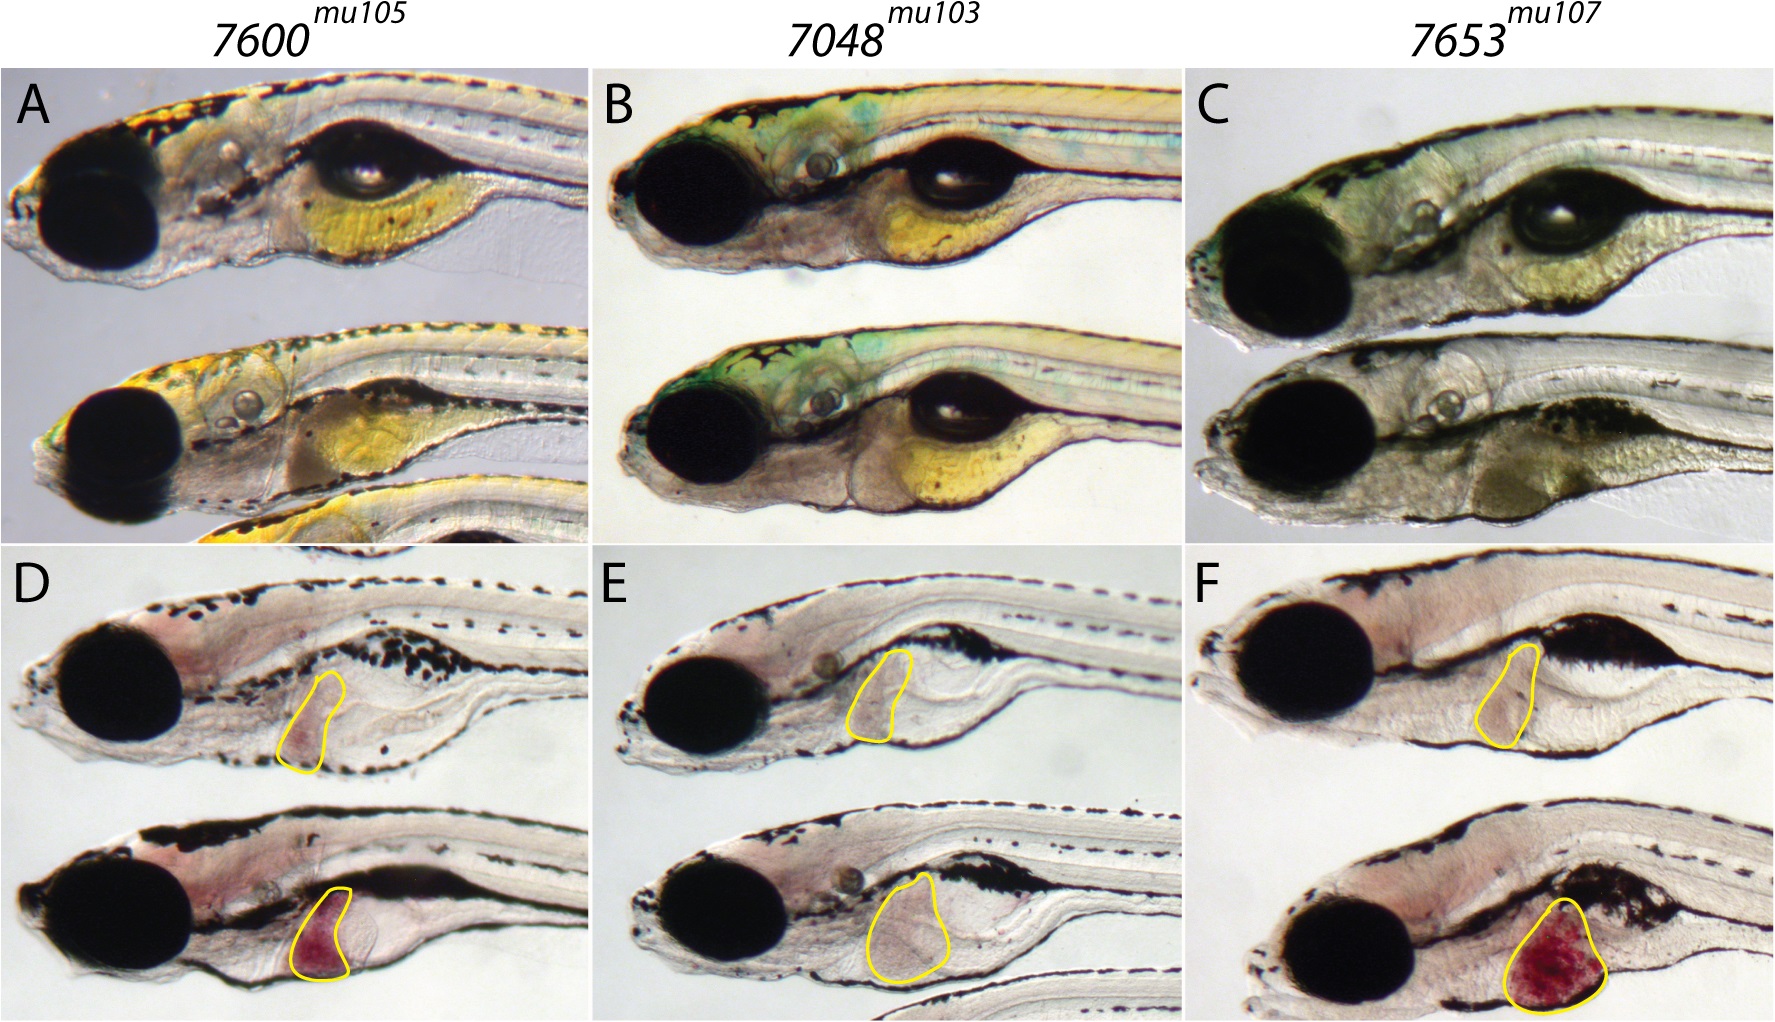
Fig. 4
Three liver phenotypes were identified in the forward genetic screen.
In all panels, the normal sibling is on top and the mutant is on the bottom. On the left, in (A, D) is shown a representative example of a mutant with hepatomegaly alone (n = 9/9). In (B, E) is shown a representative mutant with steatosis alone (n = 9/9), and (C,F) show a mutant with both hepatomegaly and steatosis (n = 9/9). In (A-C), are depicted representative stereomicroscopic images and in (D-F), whole mount ORO stained specimens. The liver is outlined in yellow.
Figure Data
Acknowledgments
This image is the copyrighted work of the attributed author or publisher, and
ZFIN has permission only to display this image to its users.
Additional permissions should be obtained from the applicable author or publisher of the image.
Full text @ PLoS One