
|
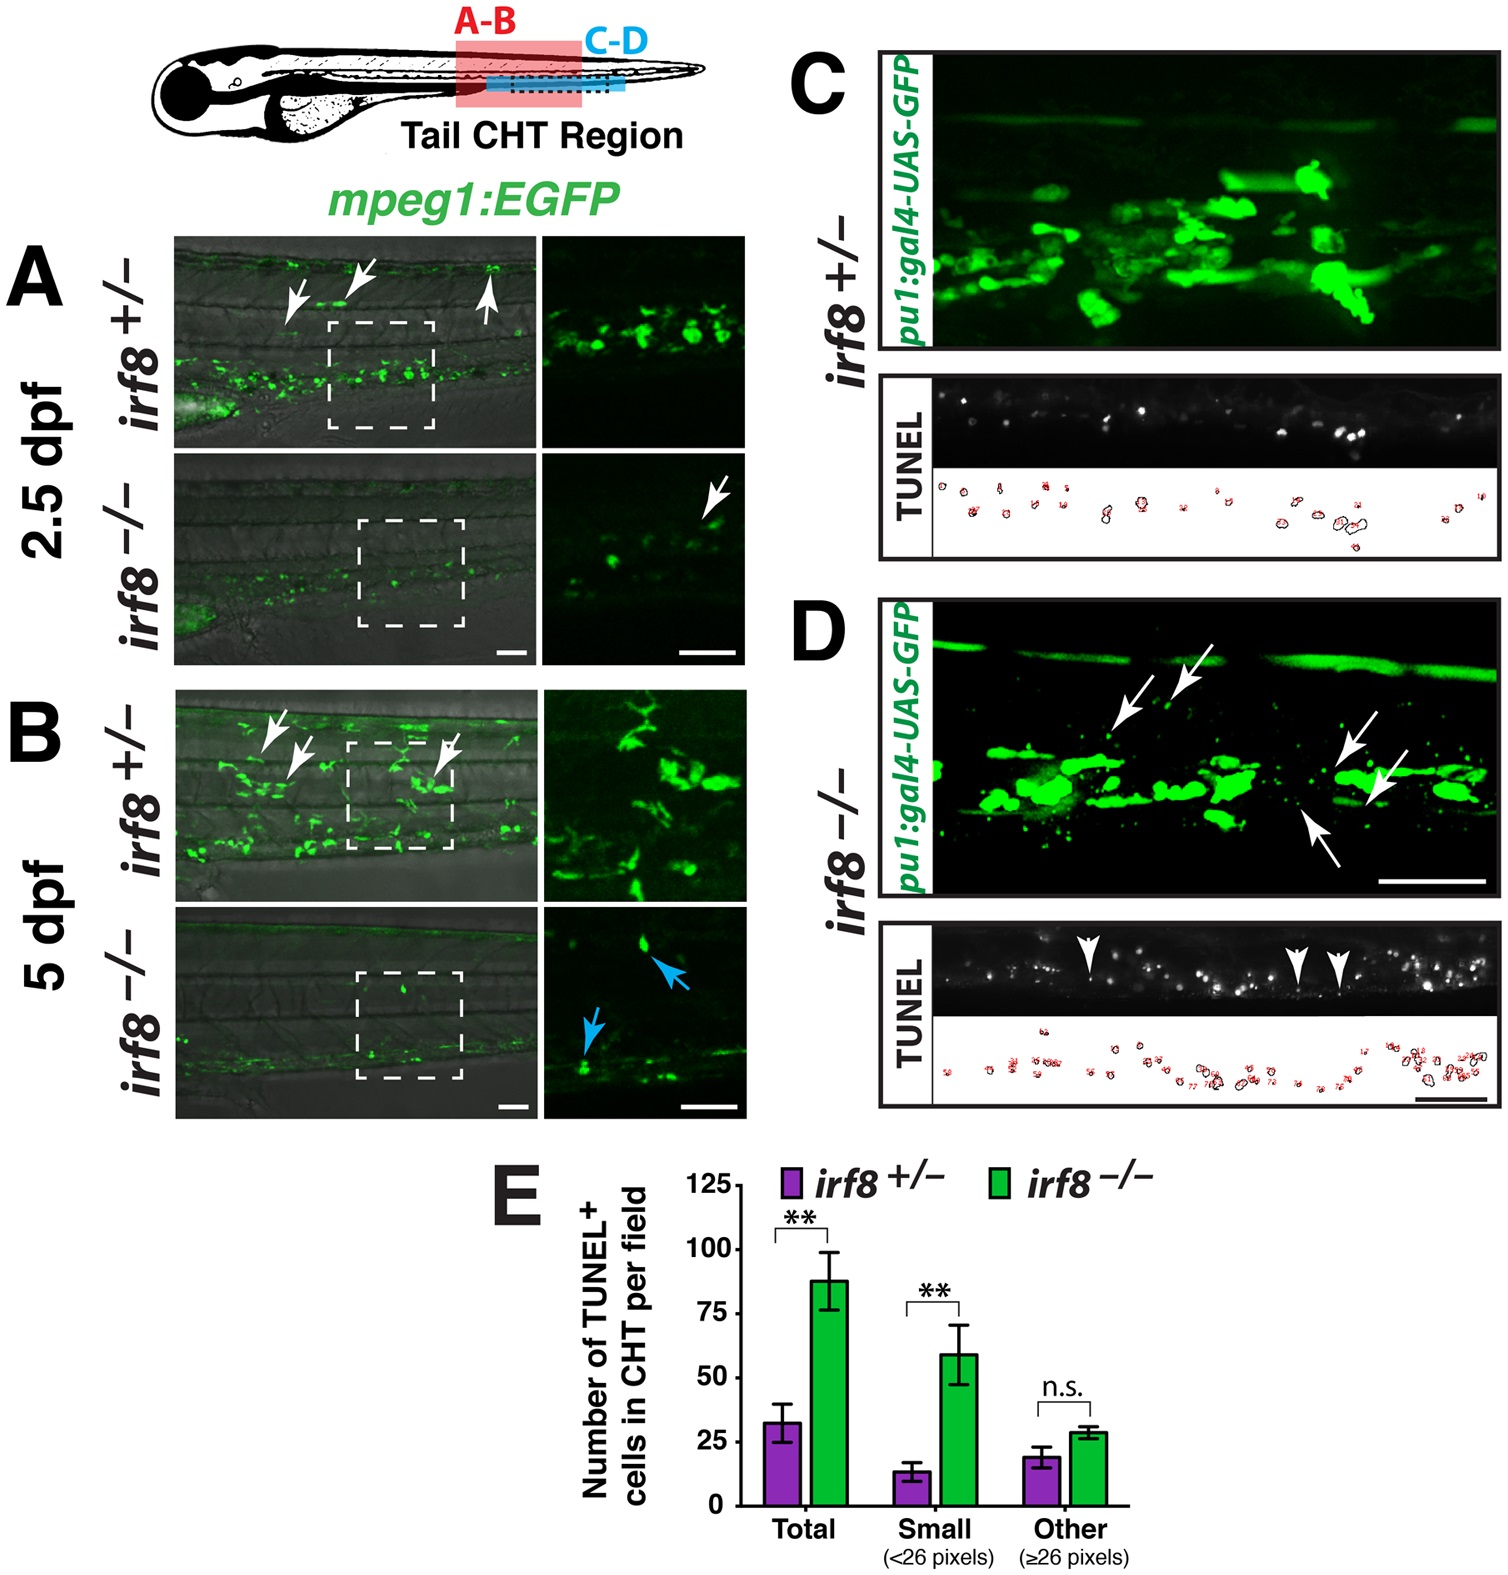
Fig. 3
irf8 mutants have immature myeloid cells and excess myeloid cell death during development in the CHT.
Diagram of a zebrafish larva showing the regions of analysis in the CHT: red box, region in A and B; blue box, region in C and D; and dotted lines in blue box indicate area of TUNEL quantification in E. (A-B) Lateral view. Right panels, higher magnification of the dotted box shown on the left. Analysis at 2.5 dpf (A) and 5 dpf (B) shows that siblings have many macrophages strongly expressing mpeg1:EGFP; these cells have elaborate processes and complex morphologies, and some have migrated into other tissues (white arrows). By contrast, irf8 mutants have cells weakly expressing mpeg1:EGFP that appear immature and different from macrophages in siblings. A few strongly expressing cells are first detected in mutants at 5 dpf (B, blue arrows), indicating recovery of a few macrophages. (C-D) Early myeloid reporter pu.1:gal4-UAS-GFP at 5 dpf shows abnormally small cellular specks restricted to the CHT in all mutants (D, arrows, n = 9/9 at 3 and 5 dpf) but not in the siblings (C, n = 5/5 at 3 and 5 dpf). Bottom, TUNEL labeling of apoptotic cells at 5 dpf. The small pu.1 reporter expressing cellular specks in the CHT are similar in size and appearance to small-sized dying cells labeled by TUNEL, which are shown in another 5 dpf stage-matched irf8 mutant larva (compare arrows in top panel with arrowheads in bottom panel from different larvae). TUNEL labeling (middle) and area traces of the TUNEL+ nuclei (bottom) are shown for each genotype. (E) Quantification of TUNEL assay as represented in C-D shows a significant increase in total dying cells in the CHT of irf8 mutants (n = 3) compared with siblings (n = 6; p = 0.0039). This is largely accounted for by a significant increase in very small-sized TUNEL+ cells measuring less than 26 pixels in area (p = 0.0017). No significant difference was found in larger TUNEL+ cells (e 26 pixels in area, p = 0.16). Error bars represent S.E.M. Statistical significance was determined by two-tailed Student’s t-test. **, p < 0.01; *, p < 0.05; n.s., not significant; CHT, caudal hematopoietic tissue. All scale bars are 50 um and are the same for each set of panels.