
Image
|
Figure Caption
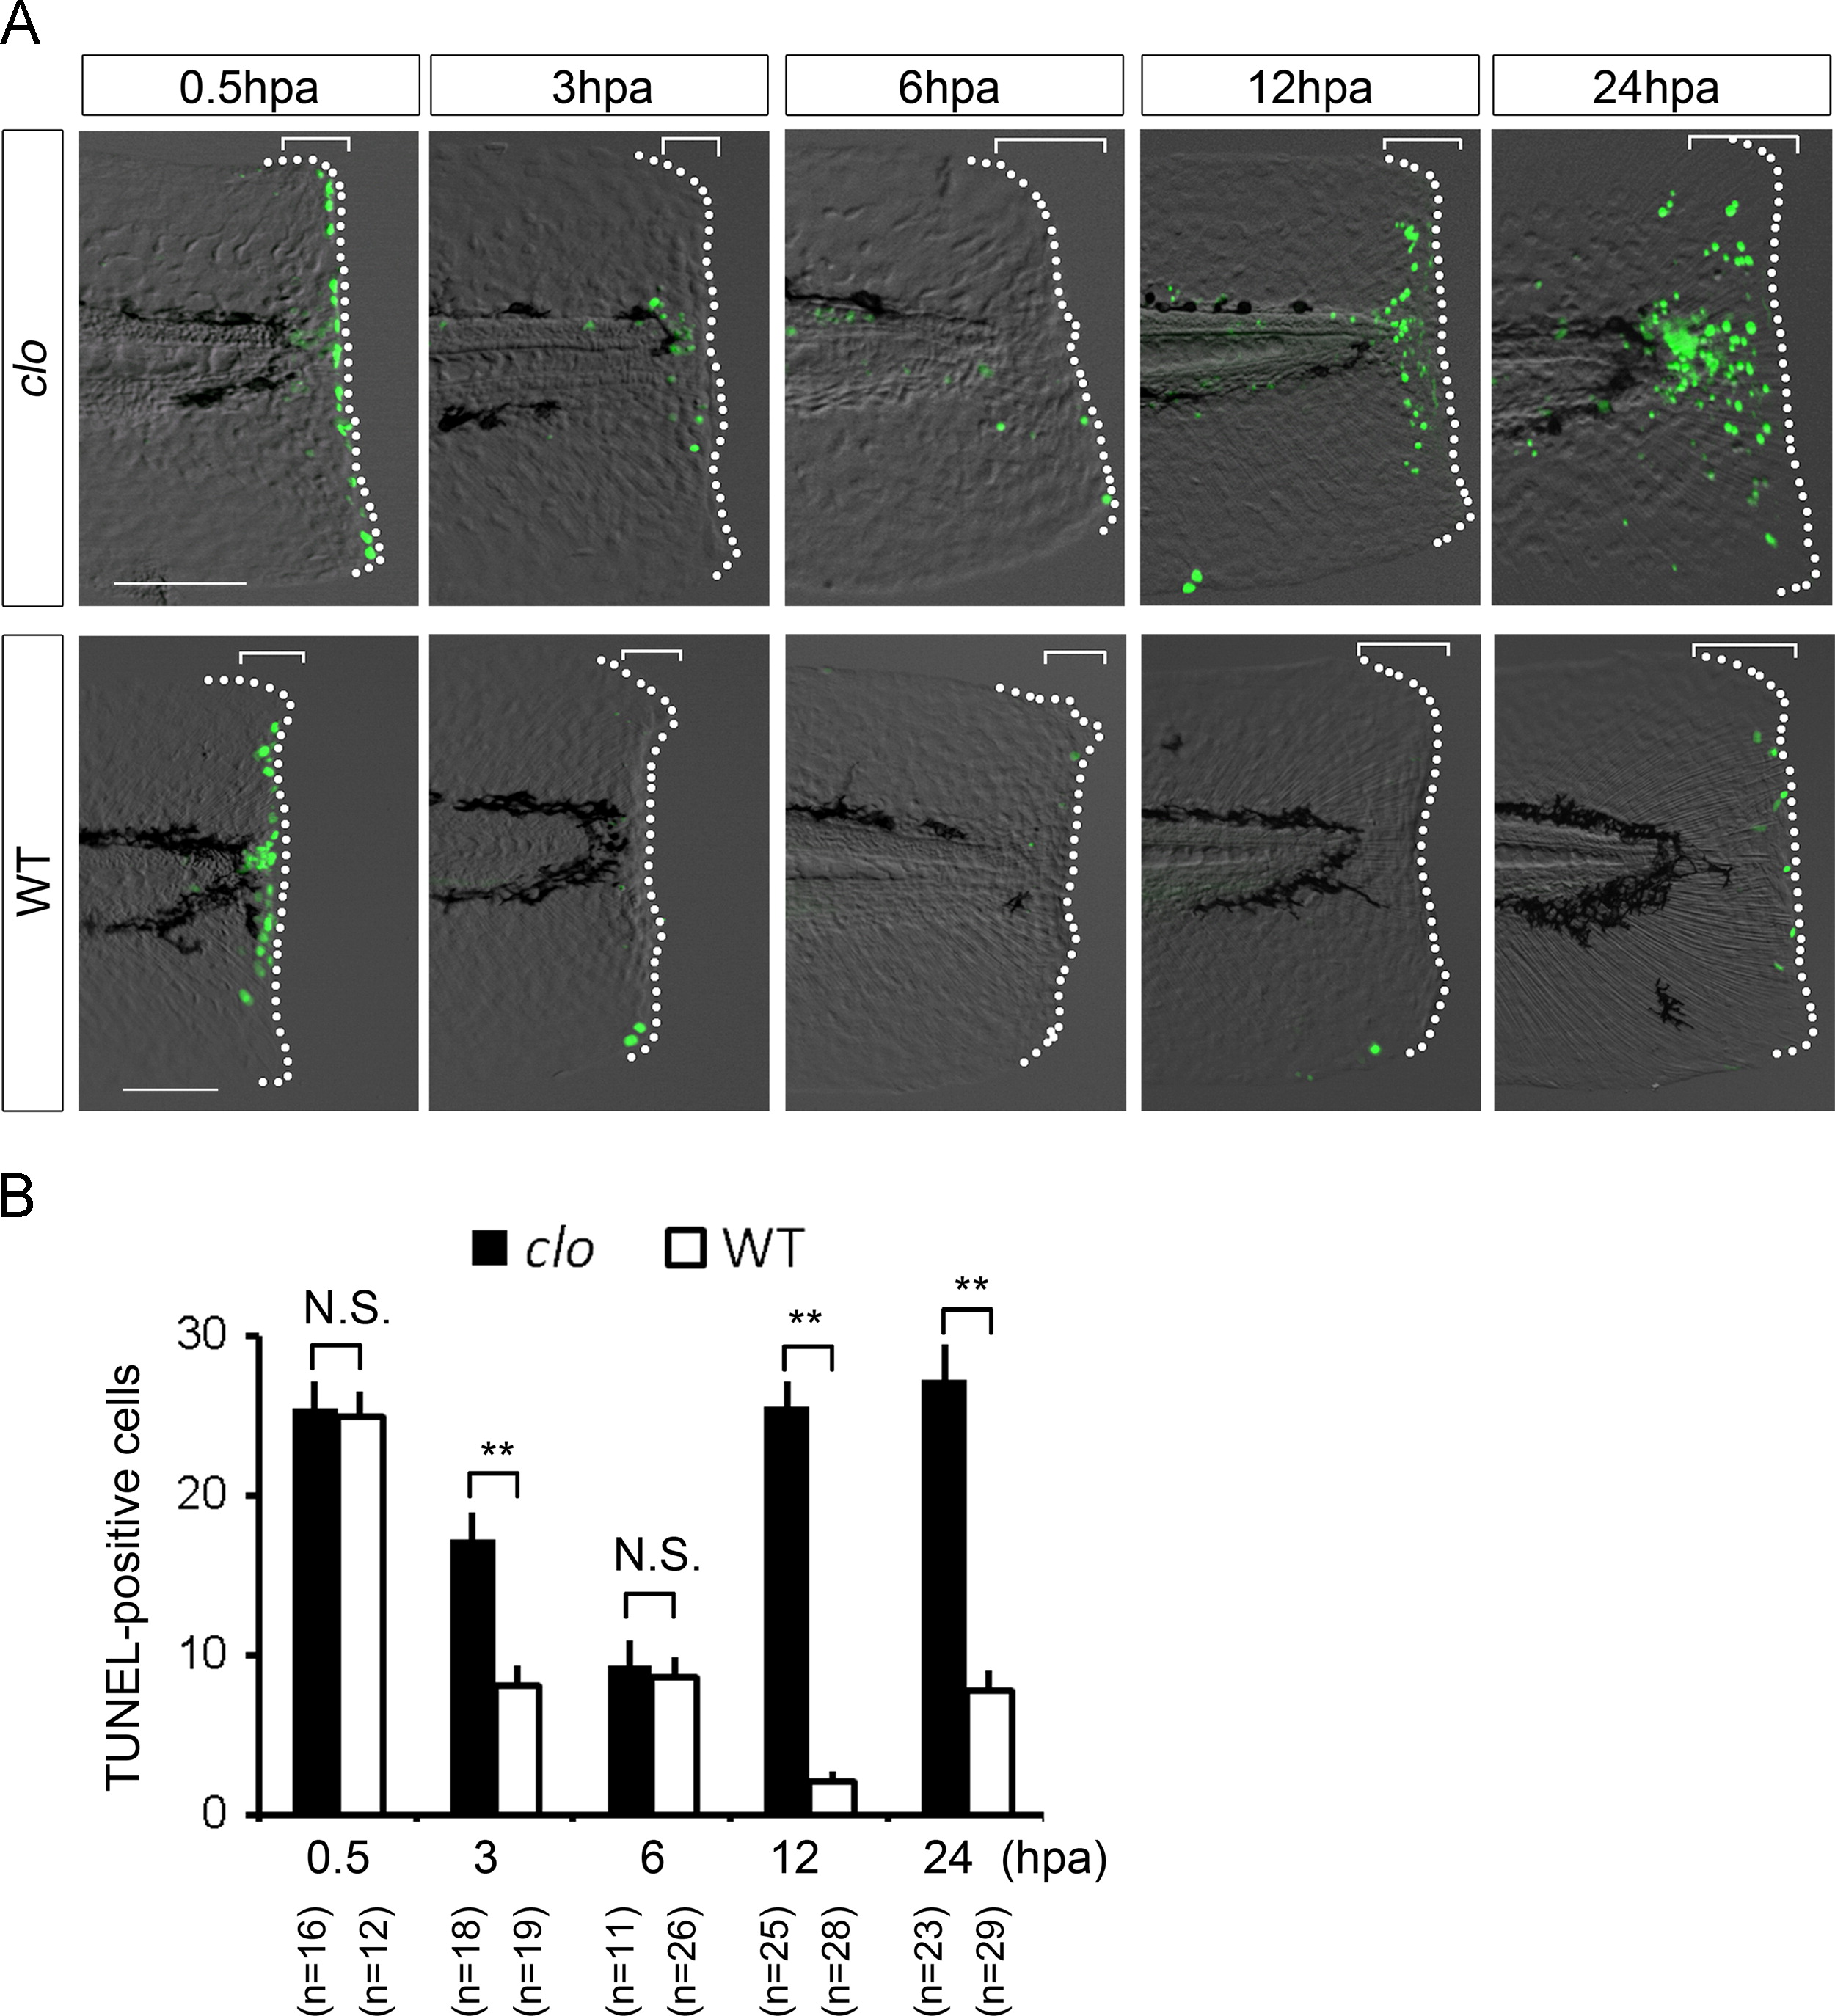
Fig. 2
Temporal change of cell death in the clo mutant and wild-type after fin fold amputation. (A) TUNEL analysis of cell death at respective stages of fin fold regeneration in the clo mutant and wild-type. Note that mutant-specific cell death was only observed at 12 hpa and afterward. Scale bars for clo and wild-type represent 100 µm, respectively. (B) Quantification of TUNEL analysis. The TUNEL-positive cells in the bracketed areas in (A) were scored. Data are presented as mean±s.e.m. Statistical significance was tested using Welchós t test. **P<0.001.
Acknowledgments
This image is the copyrighted work of the attributed author or publisher, and
ZFIN has permission only to display this image to its users.
Additional permissions should be obtained from the applicable author or publisher of the image.
Reprinted from Developmental Biology, 399(1), Hasegawa, T., Nakajima, T., Ishida, T., Kudo, A., Kawakami, A., A diffusible signal derived from hematopoietic cells supports the survival and proliferation of regenerative cells during zebrafish fin fold regeneration, 80-90, Copyright (2015) with permission from Elsevier. Full text @ Dev. Biol.