
|
Fig. 5
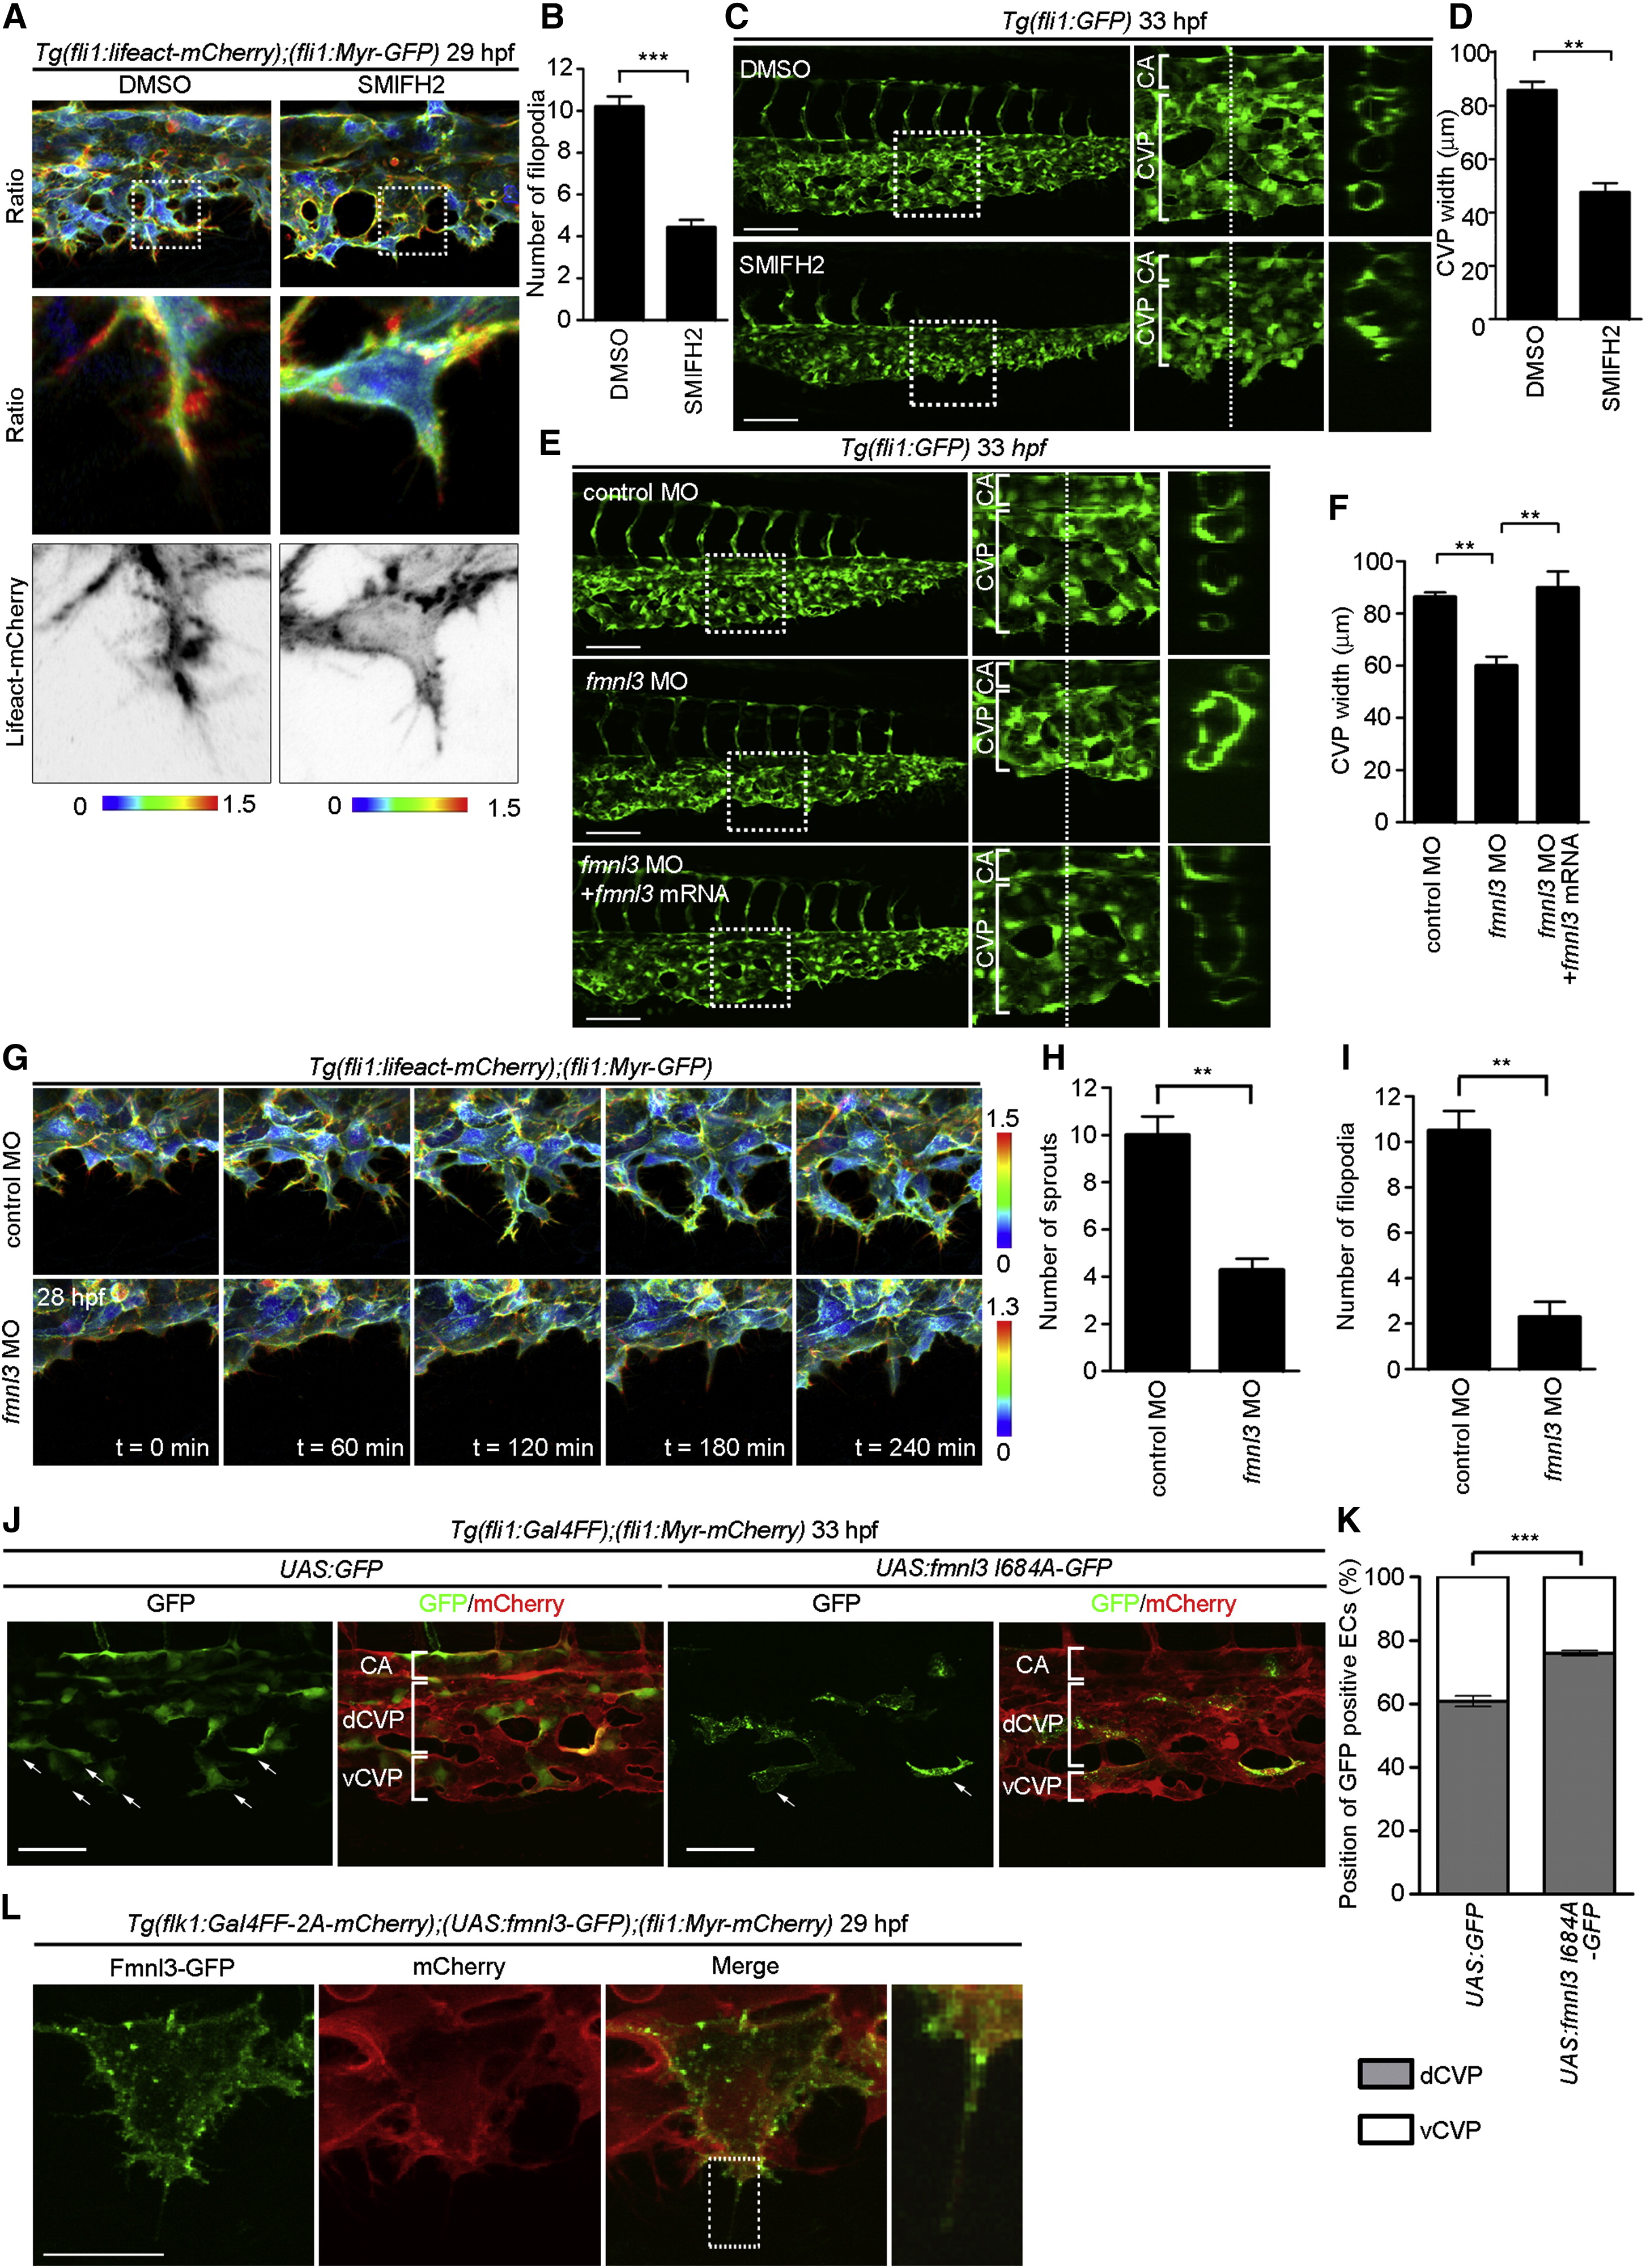
Fmnl3 Is Required for EC to Extend into Filopodia during CVP Formation
(A) 3D-rendered confocal images of the CVP of 29 hpf Tg(fli1:lifeact-mCherry);(fli1:Myr-GFP) embryos treated with DMSO or 1 µM SMIFH2, a formin inhibitor, from 25 to 29 hpf are shown as in Figure 1A.
(B) The number of filopodia for each EC located at the vascular front, as observed in (A), was quantified as in Figure 1D (DMSO, n = 10; SMIFH2, n = 12).
(C) Projection view of confocal z stack images of the caudal regions of 33 hpf Tg(fli1:GFP) embryos treated with DMSO or SMIFH2 from 24 to 33 hpf are shown as in Figure 1G.
(D) The CVP width, as observed in (C), was quantified as in Figure 1H (DMSO, n = 7; SMIFH2, n = 9). Error bars indicate means ± SEM.
(E) Projection view of confocal z stack images of the caudal regions of 33 hpf Tg(fli1:GFP) embryos injected with 2.5 ng control MO (upper panel), 2.5 ng fmnl3 MO (middle panel), and 2.5 ng fmnl3 MO together with 100 pg MO-resistant fmnl3 mRNA (lower panel) are shown as in Figure 1G.
(F) The CVP width, as observed in (E), was quantified as in Figure 1H (control MO, n = 8; fmnl3 MO, n = 6; fmnl3 MO + fmnl3 mRNA, n = 8). Error bars indicate means ± SEM.
(G) 3D-rendered confocal images of the CVP of 28 hpf Tg(fli1:lifeact-mCherry);(fli1:Myr-GFP) embryos injected with 2.5 ng control MO or 2.5 ng fmnl3 MO and their subsequent time-lapse images at the indicated time points. The ratio images of mCherry/GFP are shown as in Figure 1A.
(H) The number of sprouts extending from the CV primordia, as observed in (G), was quantified as in Figure 2B (control MO, n = 8; fmnl3 MO, n = 8). Error bars indicate means ± SEM.
(I) The number of filopodia for each EC located at the vascular front as observed in (G) was quantified as in Figure 1D (control MO, n = 8; fmnl3 MO, n = 8). Error bars indicate means ± SEM.
(J) Projection views of confocal z stack images of the caudal regions of 33 hpf Tg(fli1:Gal4FF);(fli1:Myr-mCherry) embryos injected with UAS:GFP Tol2 vector (UAS:GFP) or UAS:fmnl3 I684A-GFP Tol2 plasmid (UAS:fmnl3 I684A-GFP) are shown as in Figure 2D.
(K) Percentages of GFP-expressing ECs localizing in the dorsal part of CVP (dCVP) or the ventral part of CVP (vCVP), as observed in (J), are shown as mean ± SEM (UAS:GFP, n = 3; UAS:fmnl3 I684A-GFP, n = 3). Error bars indicate means ± SEM.
(L) Projection view of confocal z stack images of one of the ECs located at the vascular front of the CVP in a Tg(flk1:Gal4FF-2A-mCherry);(UAS:fmnl3-GFP);(fli1:Myr-mCherry) embryo at 29 hpf. GFP (Fmnl3-GFP) and mCherry images and the merged image (Merge) are shown as indicated at the top. The boxed area on the merged image is enlarged on the right.
Scale bars, 100 µm in (C) and (E), 50 µm in (J), and 20 µm in (L). p < 0.01; p < 0.001. See also Figure S5 and Movie S6.
Reprinted from Developmental Cell, 32, Wakayama, Y., Fukuhara, S., Ando, K., Matsuda, M., Mochizuki, N., Cdc42 Mediates Bmp-Induced Sprouting Angiogenesis through Fmnl3-Driven Assembly of Endothelial Filopodia in Zebrafish, 109-22, Copyright (2015) with permission from Elsevier. Full text @ Dev. Cell