
|
Fig. 4
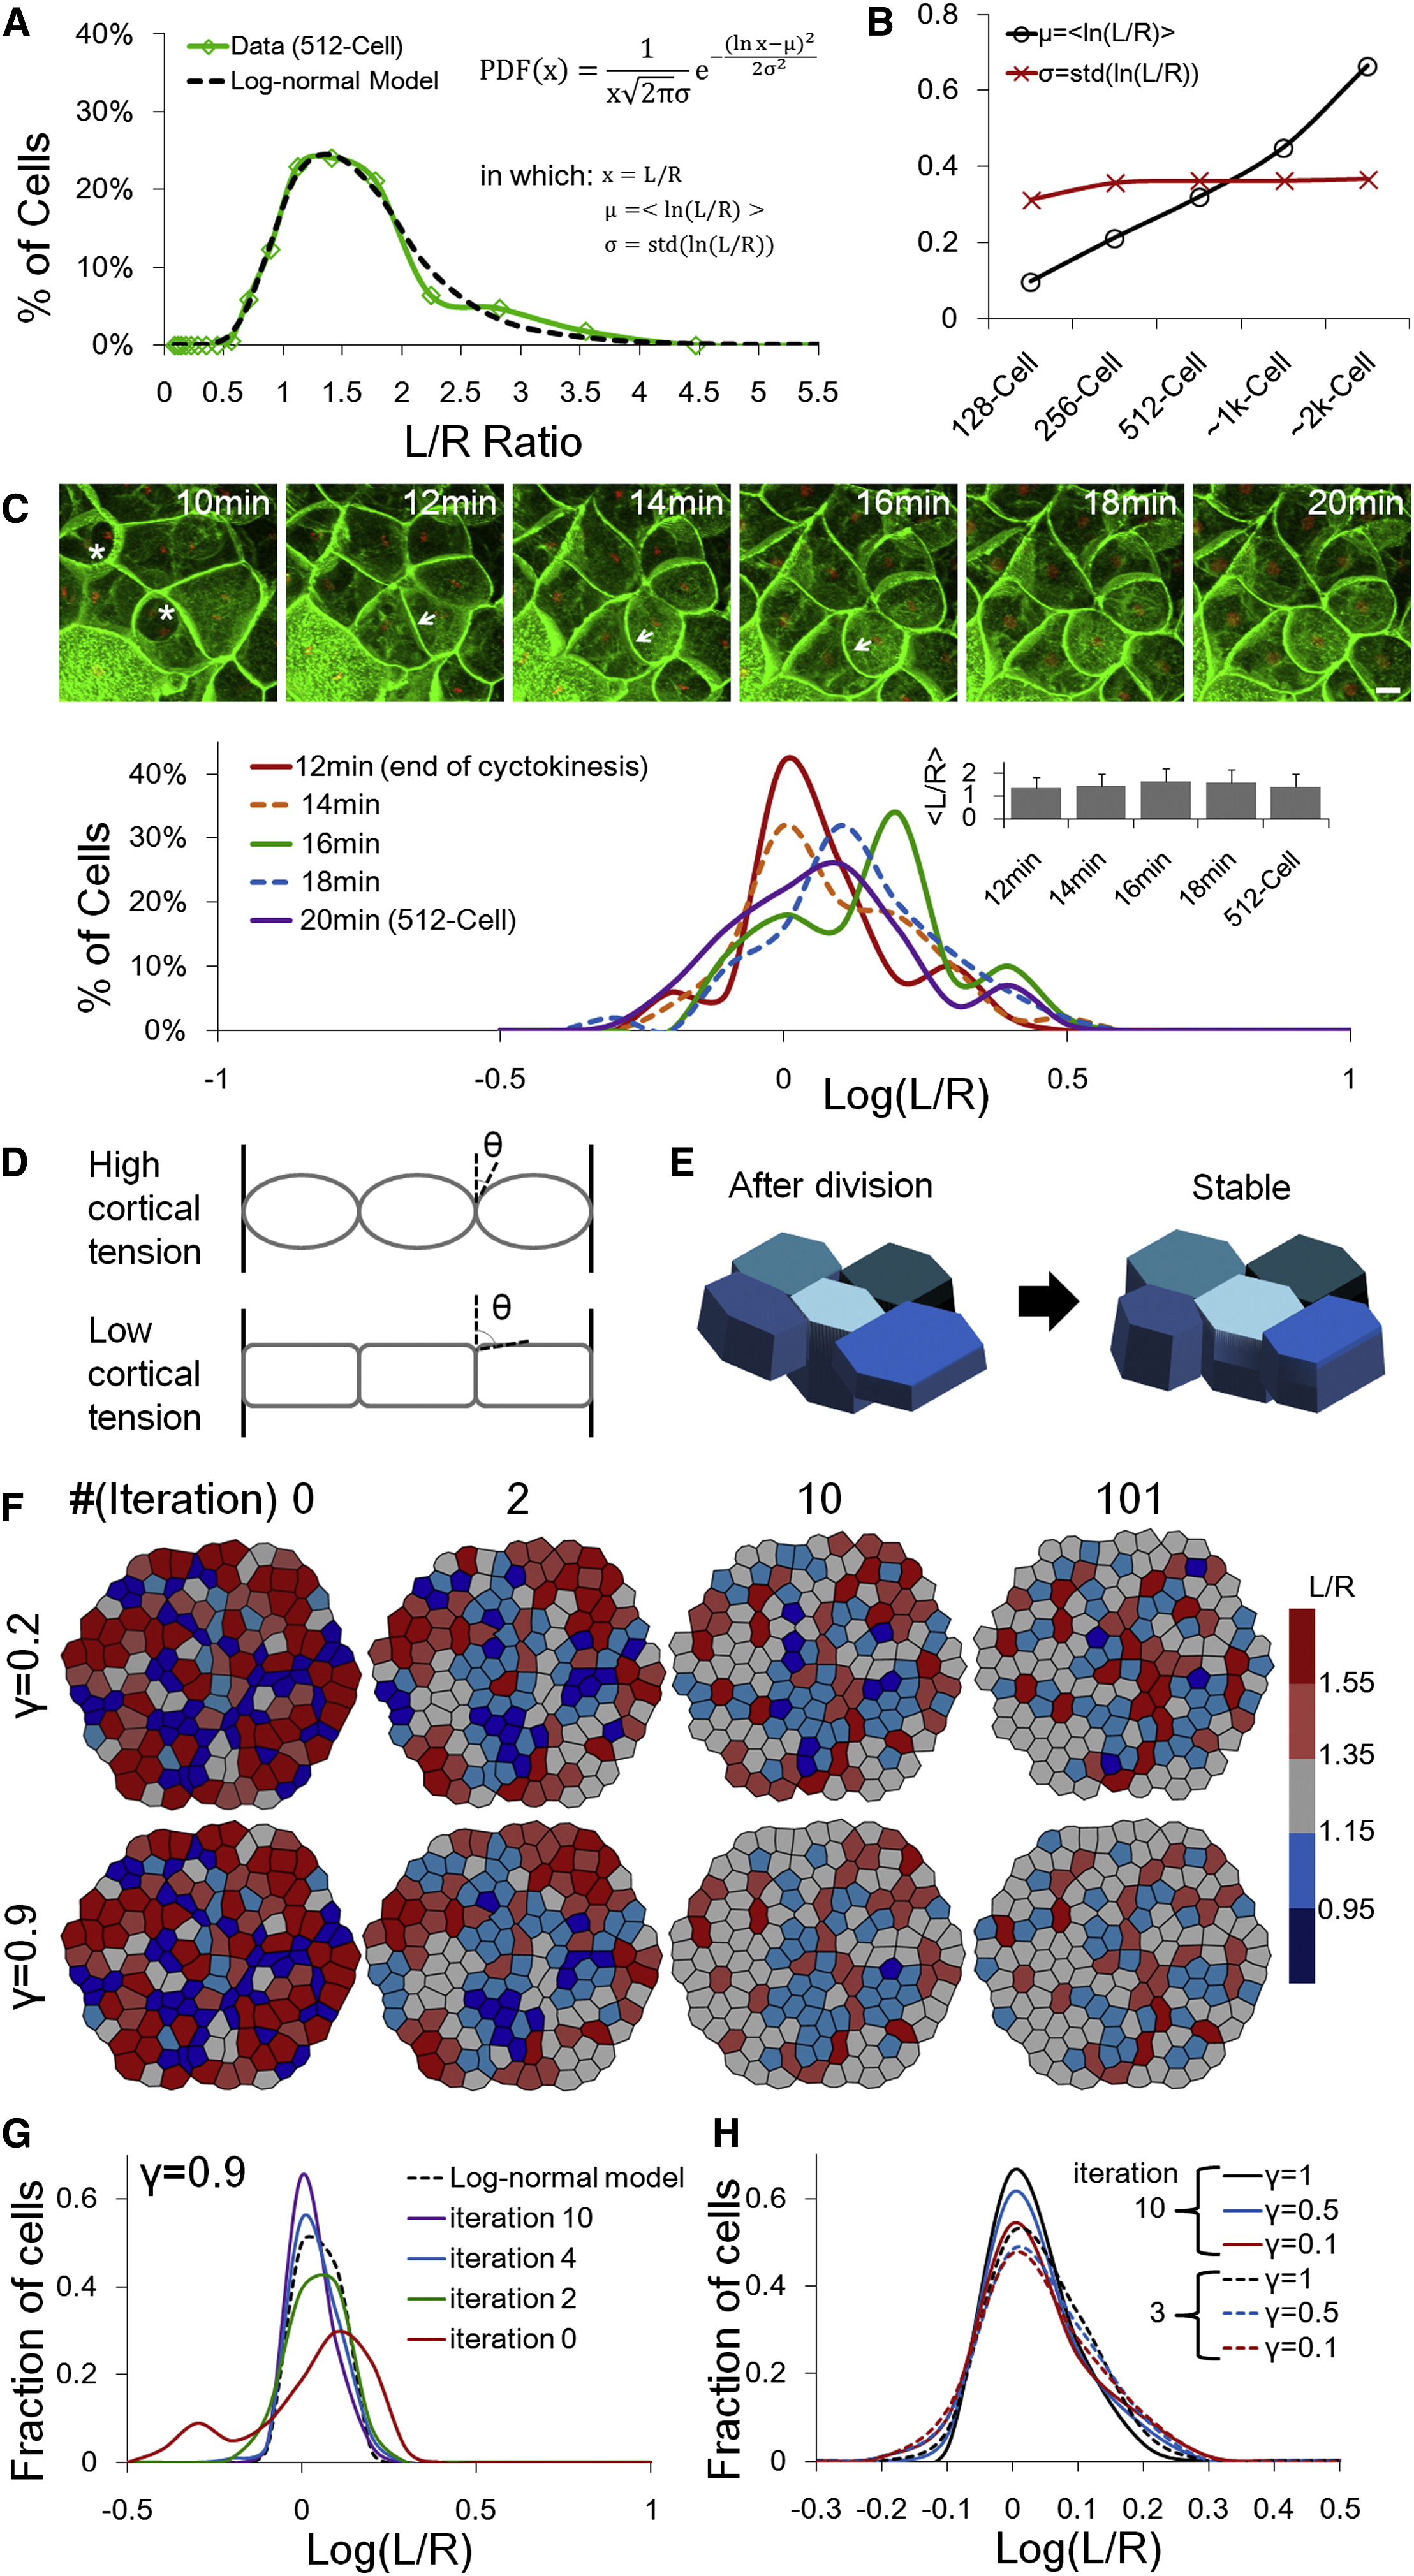
Mechanical Regulations on the Cell Shape Distributions
(A) A log-normal model fit of the cell shape distribution data (512 cell stage from Figure 1E, log-normal model p = 0.16, normal model (rejected): p = 2.7 � 104, ?2 tests). See also Figure S4A and Data S1, Text 6 for other time points and statistics.
(B) Cell shape distributions represented by two parameters under the log-normal assumption. The differences between pairs of � are significant (t tests) and the differences between pairs of ? are not significant (f tests).
(C) Cell shape changes after mitosis. Images show a group of surface cells changing surface areas following division (green, cell membrane; red, cell nuclei). Asterisks indicate S-D dividing cells in cytokinesis. Arrows show a S-S daughter expanding boundaries into a S-D daughter thus reducing their initial differences in L/R after divisions. Plot shows the shape distribution changes following division. Inset: corresponding <L/R> values (not significantly different, t tests on ln(L/R)).
(D) Schematic illustrations of surface configurations with high/low cortical tension and respective transition point angles (?). The stronger the cortical tension the smaller the value of ?. See also Figure S4D and Data S1, Text 7.
(E) Cartoon illustration of mechanical interactions changing cell shapes. The five cells have variable shapes after division then evolve to reduce surface energy while meeting the constraints of constant total surface area and cell volume. Unfavorable shapes such as very columnar and squamous cells (corresponding to low and high L/R values) are reduced.
(F) Surface Evolver modeling of the change of shape distribution after division (512 cell stage). The images show the surface view of the cells, and the R dimension is perpendicular to the image plane (equivalent of a top view on the images in [E]). The configurations arrive at a near-stable state after approximately six iterations. See also Movie S3 and Data S1, Text 8.
(G) Evolution of L/R distributions. The log-normal model uses calculated � and ? from simulated data at iteration 98 (stable state). Iterations 1?4 fit log-normal (?2 tests).
(H) Effect of ? on L/R distribution change. Note the overlap between solid lines (iteration 10) from smaller ?s and dashed lines (iteration 3) from larger ?s. See also Data S1, Text 8.
Reprinted from Cell, 159, Xiong, F., Ma, W., Hiscock, T.W., Mosaliganti, K.R., Tentner, A.R., Brakke, K.A., Rannou, N., Gelas, A., Souhait, L., Swinburne, I.A., Obholzer, N.D., Megason, S.G., Interplay of Cell Shape and Division Orientation Promotes Robust Morphogenesis of Developing Epithelia, 415-427, Copyright (2014) with permission from Elsevier. Full text @ Cell