
|
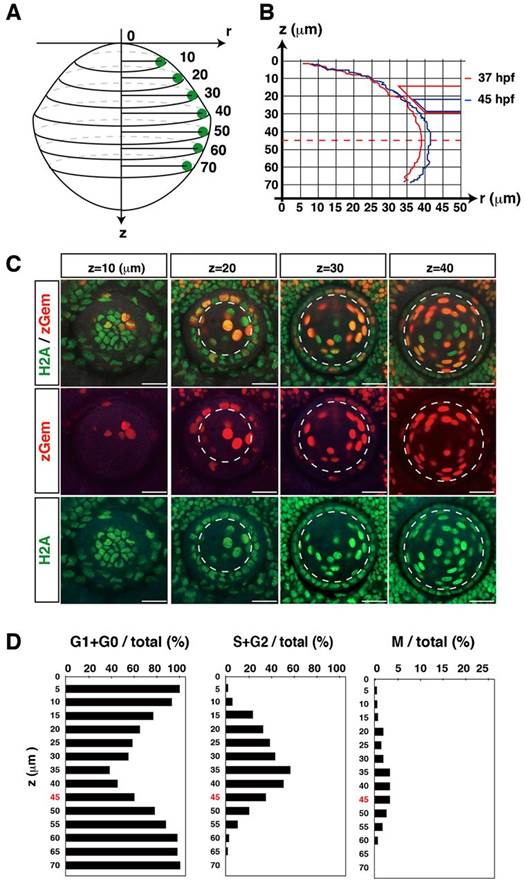
Fig. 2
(A) Coordinates of the lens. The “z-axis” indicates the distance from the antero-most plane. The “r-axis” indicates the radiusin the plane perpendicular to the z-axis. (B) Nuclear positions of lens epithelial cells for a particular lens at the beginning (37hpf, red line) and the end (45hpf, blue line) of the scanned period. Right red and blue trapezia indicate the retinal ciliary marginal zone that was associated with the lens surface at 37 and 45hpf, respectively. During the period from 37 to 45hpf, the lens grew to be slightly larger, but the z-position of the equator was not changed at z = 45µm. (C) Confocal images of the lens along the z-axis at 37hpf. The lens epithelium is distinguished as monolayer covering the lens fiber core. Dotted lines indicate the boundary between the lens epithelium and the lens fiber core. (D) Averaged percentages of G1/G0, S/G2 and M phase cells relative to the total number of lens epithelial cells along the z-axis, calculated using time-lapse scanning images every 15min during the period from 37 to 45hpf. The equator position z = 45µm is indicated by red color. Scale bars: 20µm.