
|
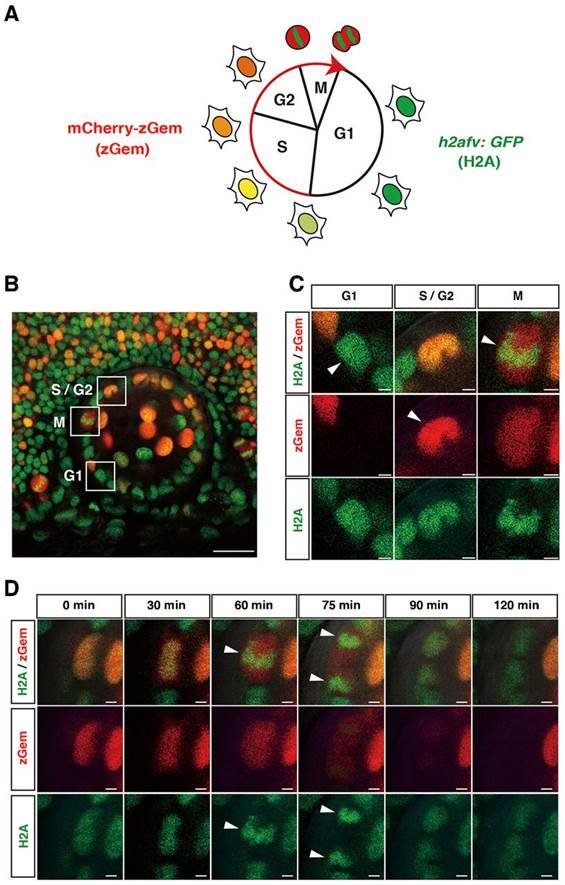
Fig. 1
(A) Fluorescent expression in a zebrafish transgenic line Tg(h2afv:GFP; EF1α:mCherry-zGem). In G1 phase, only GFP is expressed in the nucleus. mCherry fluorescence gradually increases during S phase and peaks in G2/M phase. In M phase, GFP fluorescence indicates condensed chromatin. (B) Lateral view of a 37hpf lens of a zebrafish transgenic embryo Tg(h2afv:GFP; EF1α:mCherry-zGem). Squares indicate cells in G1, S/G2 and M phases. (C) Higher magnification of squares shown in (B). Red and green channels are shown below. Arrowheads indicate GFP fluorescence in G1 phase, mCherry fluorescence in S/G2 phase, and condensed GFP fluorescence in M phase. (D) GFP and mCherry expression during M phase. During mitosis, GFP fluorescence is condensed and aligned along the plane of division (arrowhead in 60min). GFP fluorescence is segregated in opposing directions (arrowheads at 75min) and becomes a round shape at 90min. mCherry fluorescence disappears at 120min. Scale bars: 20µm (B), 2µm (C,D).