
|
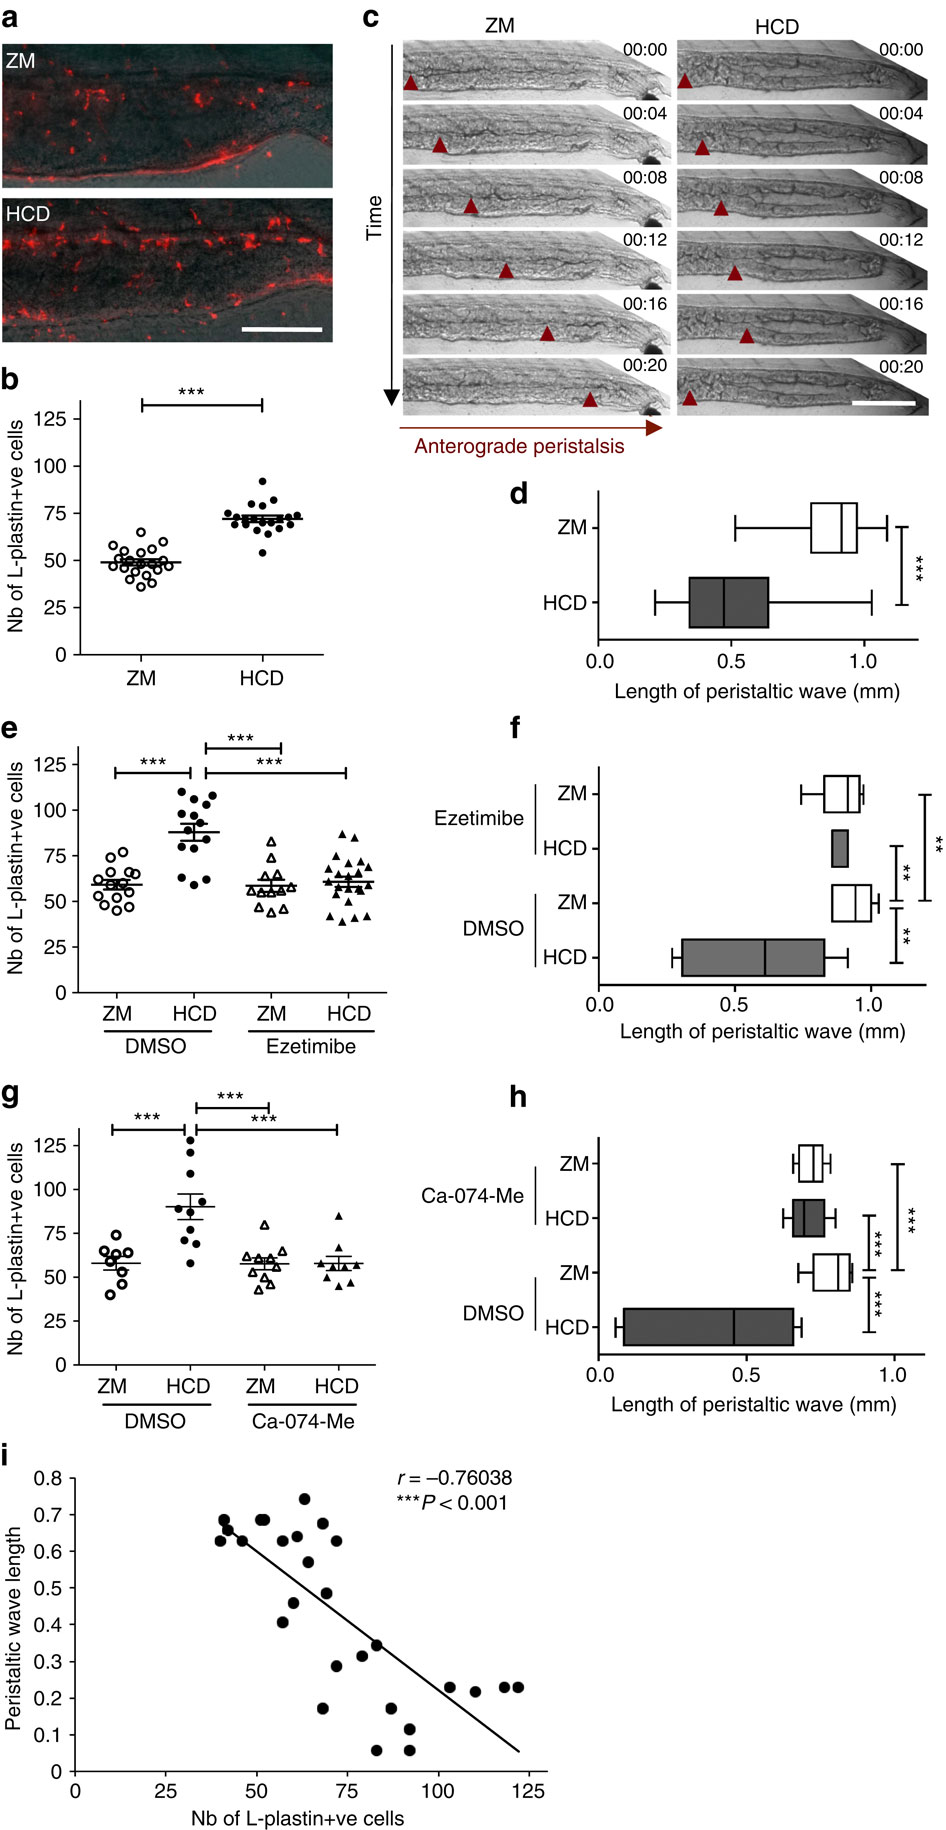
Fig. 7 Extended HCD induces sustained inflammation and impaired peristalsis.
(a) Representative images and (b) quantification of the total number of intestinal L-plastin+ cells of 15 dpf Tra-/-/ Nac-/- larvae fed HCD or ZM control for 10 days. n=20, one representative experiment of four. Scale bar, 150 µm. Two-tailed t-test. (c) Representative images and (d) average length of anterograde peristalsis with contractions (red arrowhead) over time (20 s) of the distal intestine of larvae fed (n=18). One representative experiment of three. Scale bar, 200 µm. Mann–Whitney test. (e) Total number of intestinal L-plastin+ cells (ne12) and (f) average length of peristaltic wave (ne6) of ezetimibe (25 µM)-treated larvae. One-way analysis of variance (ANOVA). (g) Total number of intestinal L-plastin+ cells (ne8) and (h) average length of peristaltic wave (ne10) of Cathepsin B inhibitor ( Ca-074-Me, 10 µM)-treated larvae. One-way ANOVA. In e–h, one experiment of two is shown. (i) Correlation of peristaltic wavelength with the total number of L-Plastin+ cells in intestine. Pearson’s correlation coefficient: 0.76. Data are pooled from two experiments. ***P<0.001 and **P<0.01. Error bars represent s.e.m.