
|
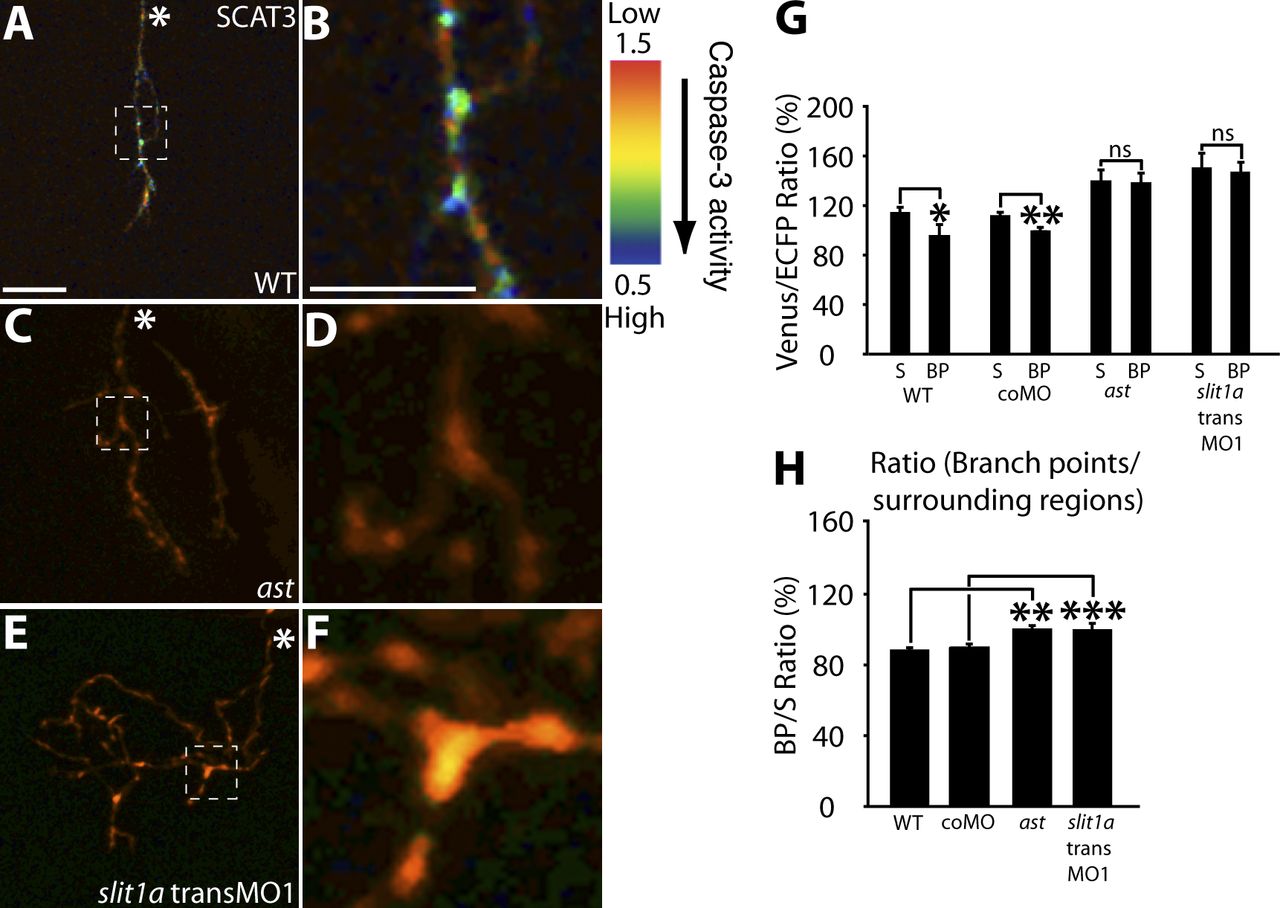
Fig. 5 Caspase activation is reduced in RGC arbors with impaired Slit1a-Robo2 signaling. (A–F) Representative IMD ratio images of 80-hpf live RGC arbors in the optic tectum expressing SCAT3. Caspase activation is represented by the pseudocolors that correspond to the Venus/ECFP ratio (1.5–0.5). Red represents low caspase activation, and violet represents high caspase activation. WT (A and B), ast (C and D), and slit1a transMO1 (E and F) are shown. The regions enclosed by the dashed squares in A, C, and E are magnified in B, D, and F. (G and H) Quantification of Venus/ECFP ratios (G) at branch points (BP) and surrounding regions (S) presented as a ratio of branch points/surrounding regions (H). White asterisks indicate the parent axon. 15–35 branch points and 45–105 surrounding areas were analyzed per condition. Dorsal views are shown, and anterior is up. Error bars represent SEMs. *, P < 0.05; **, P < 0.01; ***, P < 0.001. Bars, 10 μm. The image in A of a SCAT3-expressing arbor is shown again in Figs. 1 E and S2 C. The magnified image in B also is shown again in Fig. 1 H.