
|
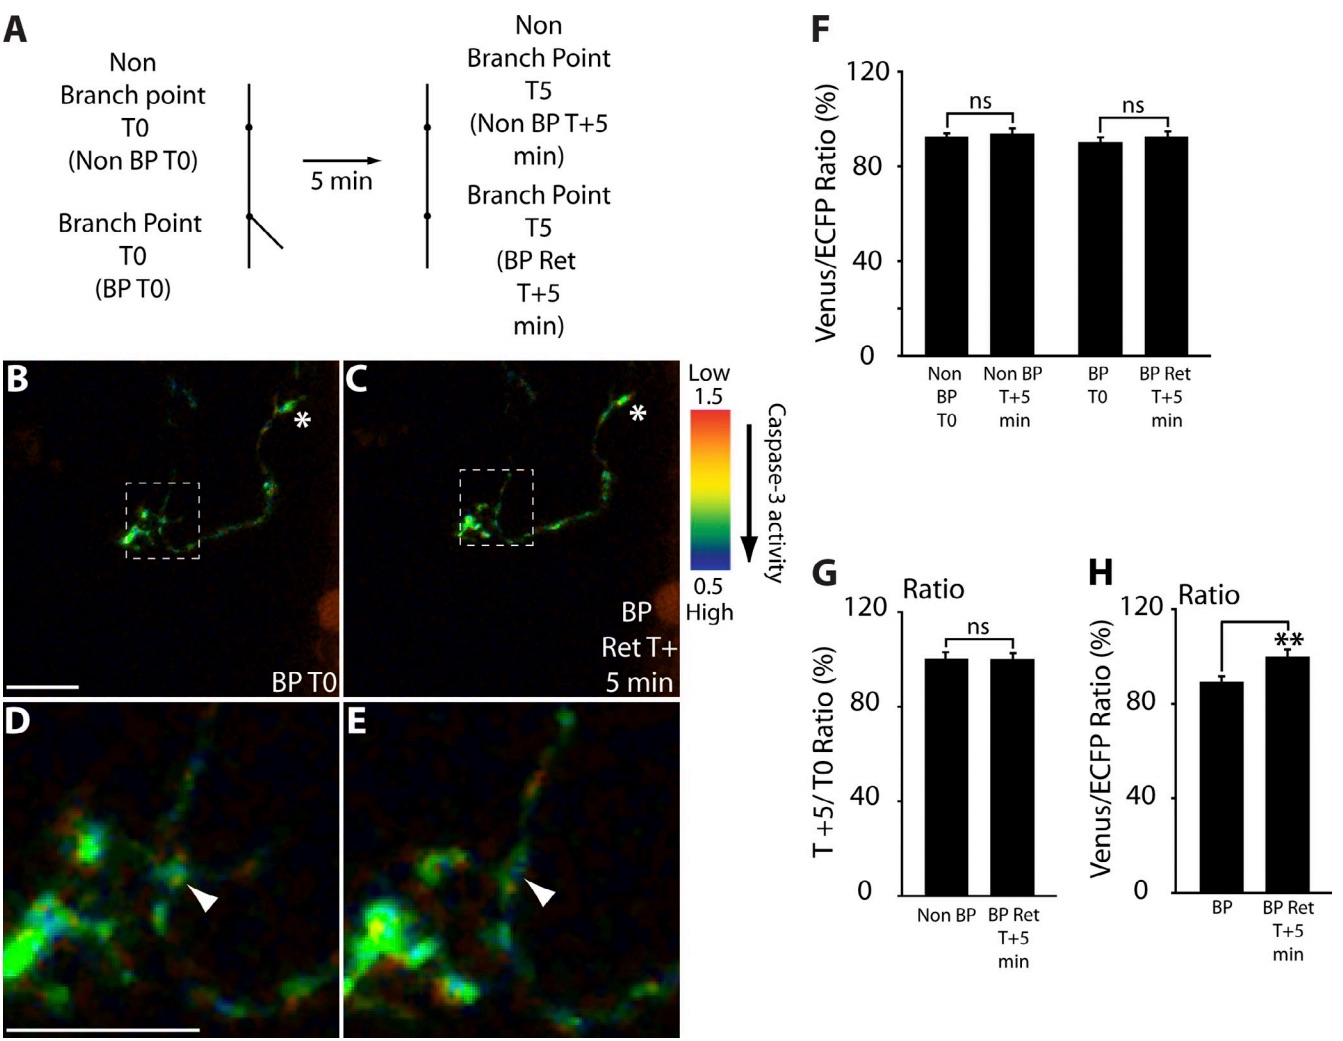
Fig. S4 Caspase activity may remain lower after branch tip retraction. (A) Imaging analysis scheme for 80-hpf arbors expressing SCAT3 undergoing branch tip retractions during the 5-min imaging interval. (B–E) Representative IMD images of an RGC arbor expressing SCAT3. Caspase activation is represented by the pseudocolors that correspond to the Venus/ECFP ratio (1.5–0.5). Red represents low caspase activation, and violet represents high caspase activation 5 min before branch tip retraction (BP T0; B) and after branch tip retraction (BP retraction [Ret] T + 5 min; C). The region enclosed by the dashed squares in B and C are magnified in D and E. (F–H) Quantification of the Venus/ECFP ratio (F) comparing changes in arbors between regions that do or do not lead to branch tip retraction as in the scheme in A and presented as ratios (G and H). (H) There was a significant difference in the ratios between recent branch point (BP) additions (data from Fig. 3 G and BP Ret T + 5 min), suggesting that caspase activation may be lower after branch tip retractions. μmWhite arrowheads depict the region, which undergoes branch tip retraction. Dorsal views are shown, and anterior is up. White asterisks indicate the parent axon. 23 branch point retractions and nonbranch points in five arbors were analyzed. Error bars represent SEMs. **, P < 0.01. Bars, 10 μm.