
|
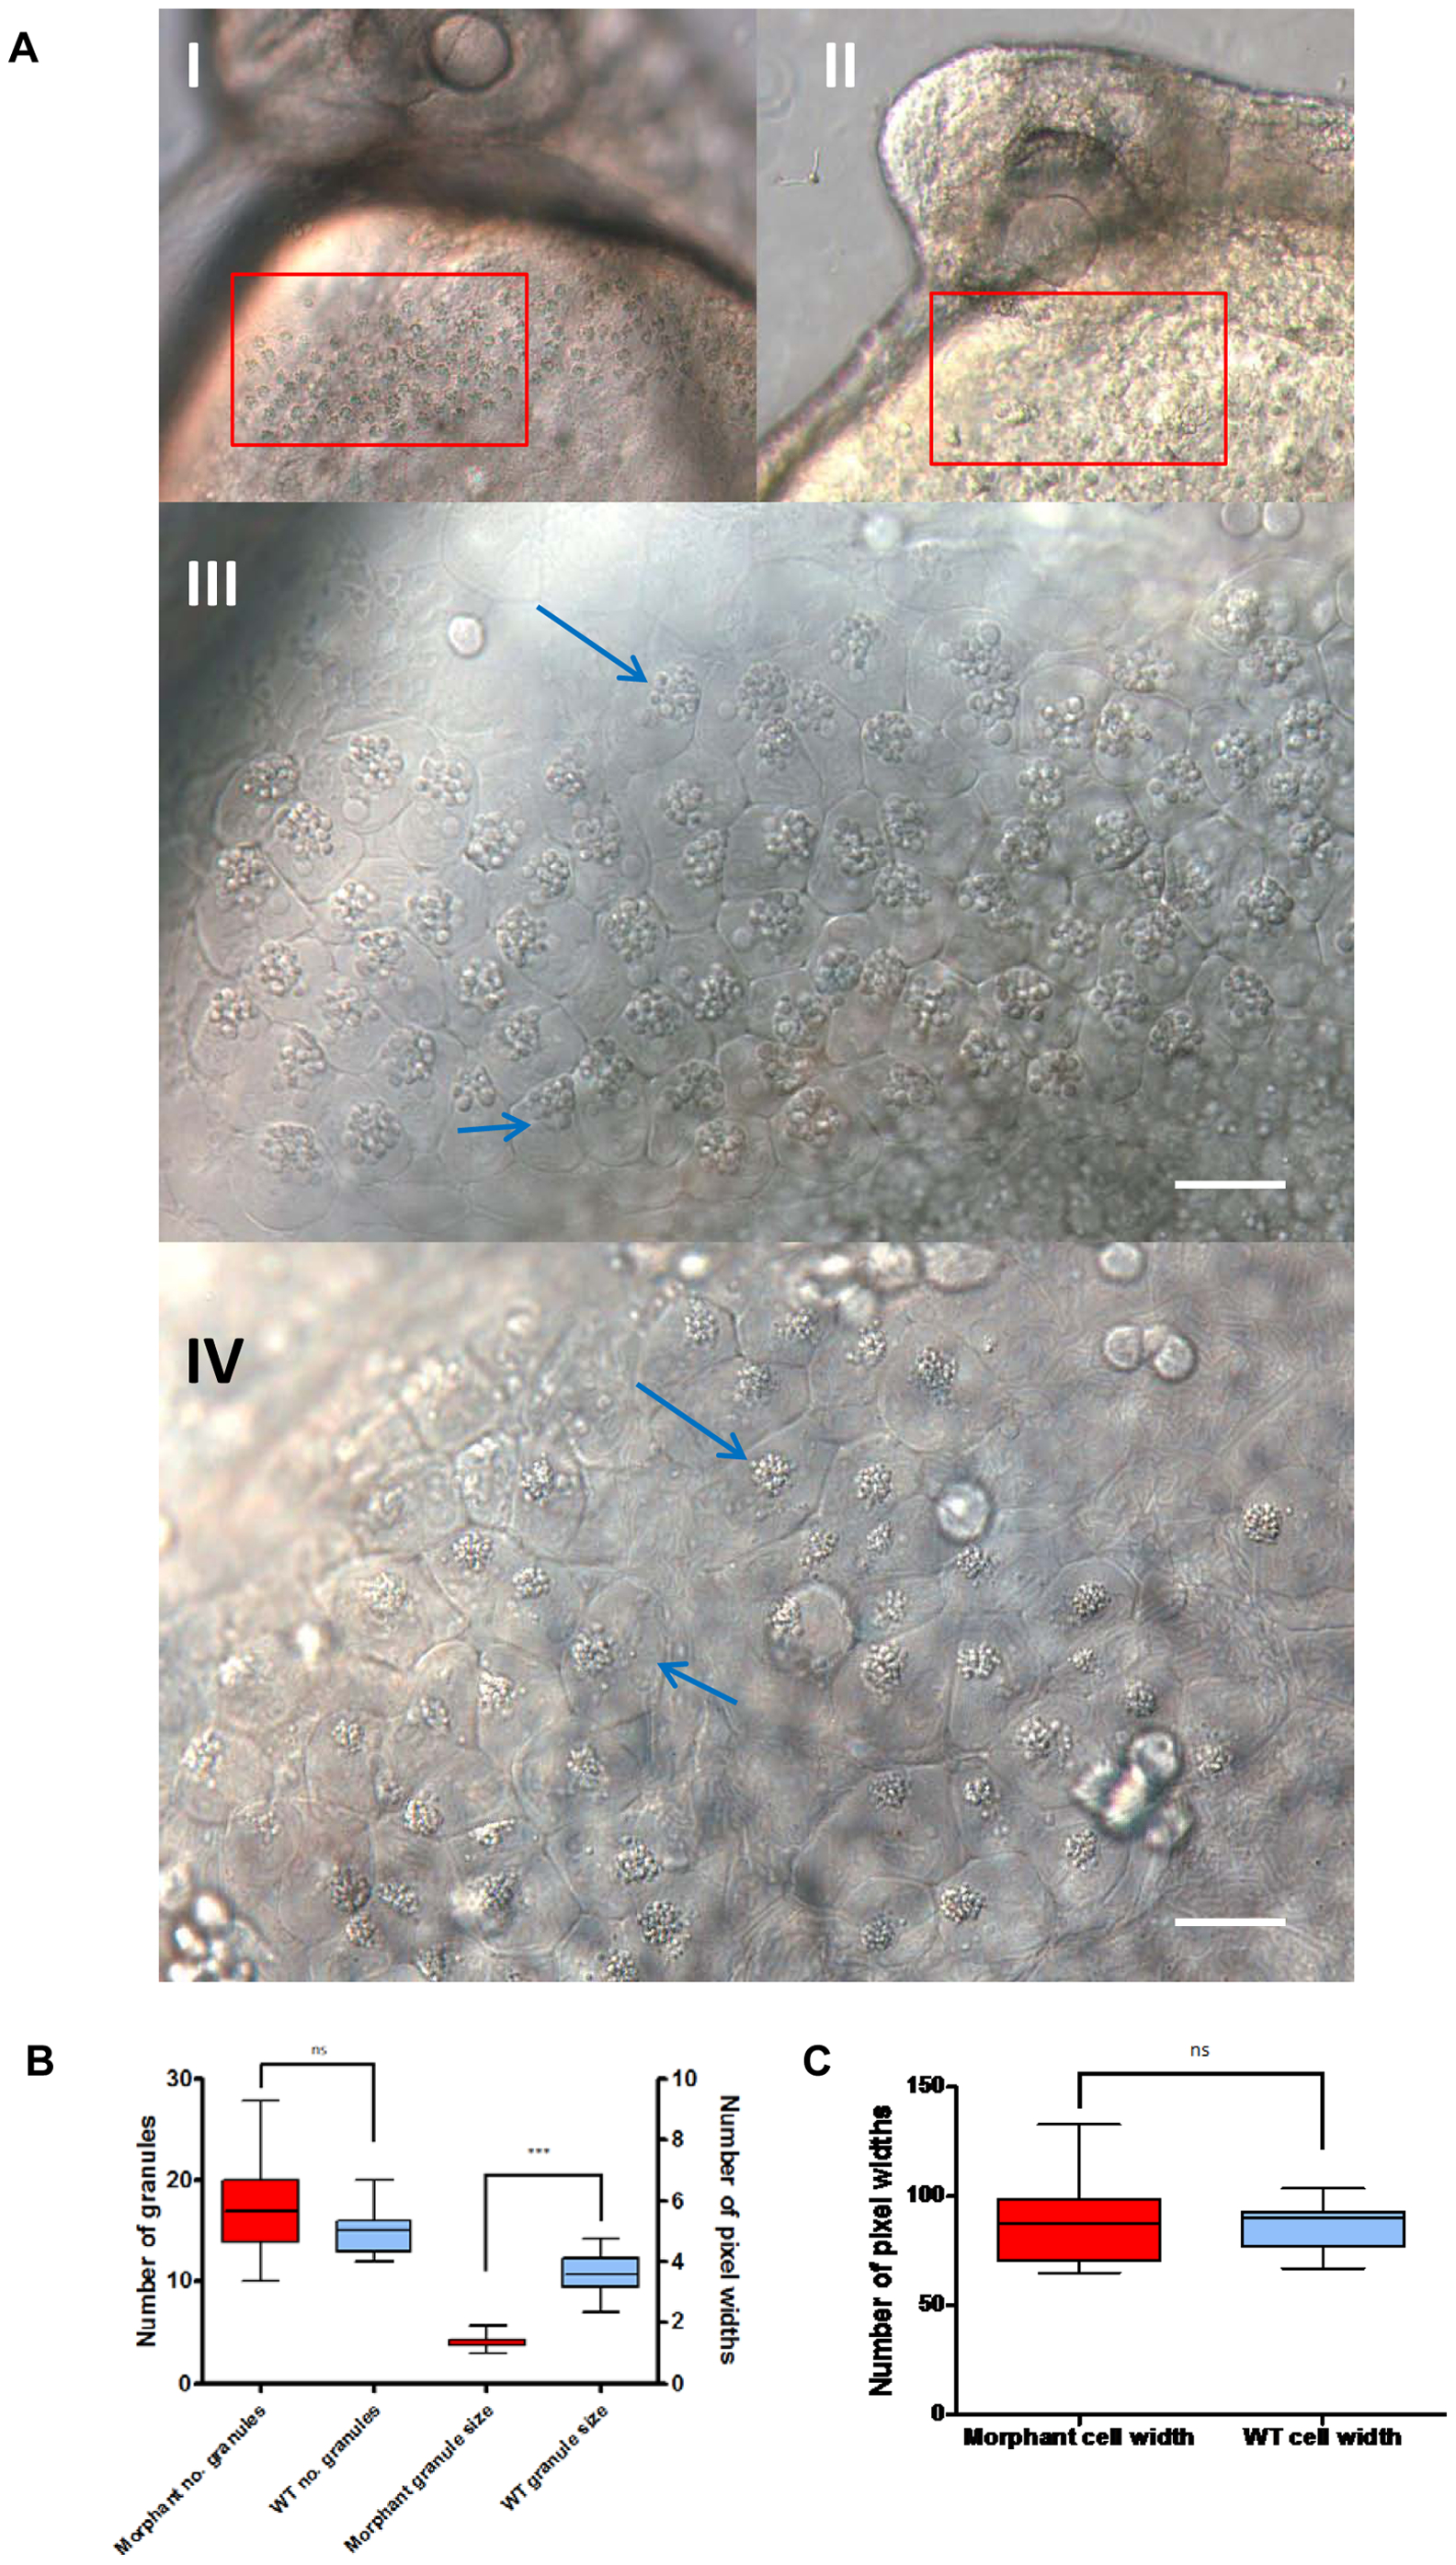
Fig. 7
Morphant hatching gland.
A. DIC microscopy images of cells of the hatching gland in a dechorinated control embryo (I and III) and morphant (II and IV) at 32 hours post fertilisation. III and IV are areas corresponding to the area of the red box in I and II respectively. Blue arrows denote intracellular granules. B and C. Analysis of hatching gland cell characteristics. Images of 3 wild type hatching glands and 3 morphant hatching glands were used for analysis with ImageJ. Distribution of data was tested to determine the relevant statistical analysis for each parameter measured. B: From each image five cells were randomly selected. Granule number was calculated and five granules randomly selected and measured. 2 tailed t-test of morphant vs. wt no. of granules per cell- no significant difference; Wilcoxon matched pairs test of morphant vs. wt granule size- p = <0.0001 *** significantly different. C: From each image five cells were randomly selected and measured at the widest diameter. 2 tailed t-test of morphant vs. wt cell size- no significant difference.