
|
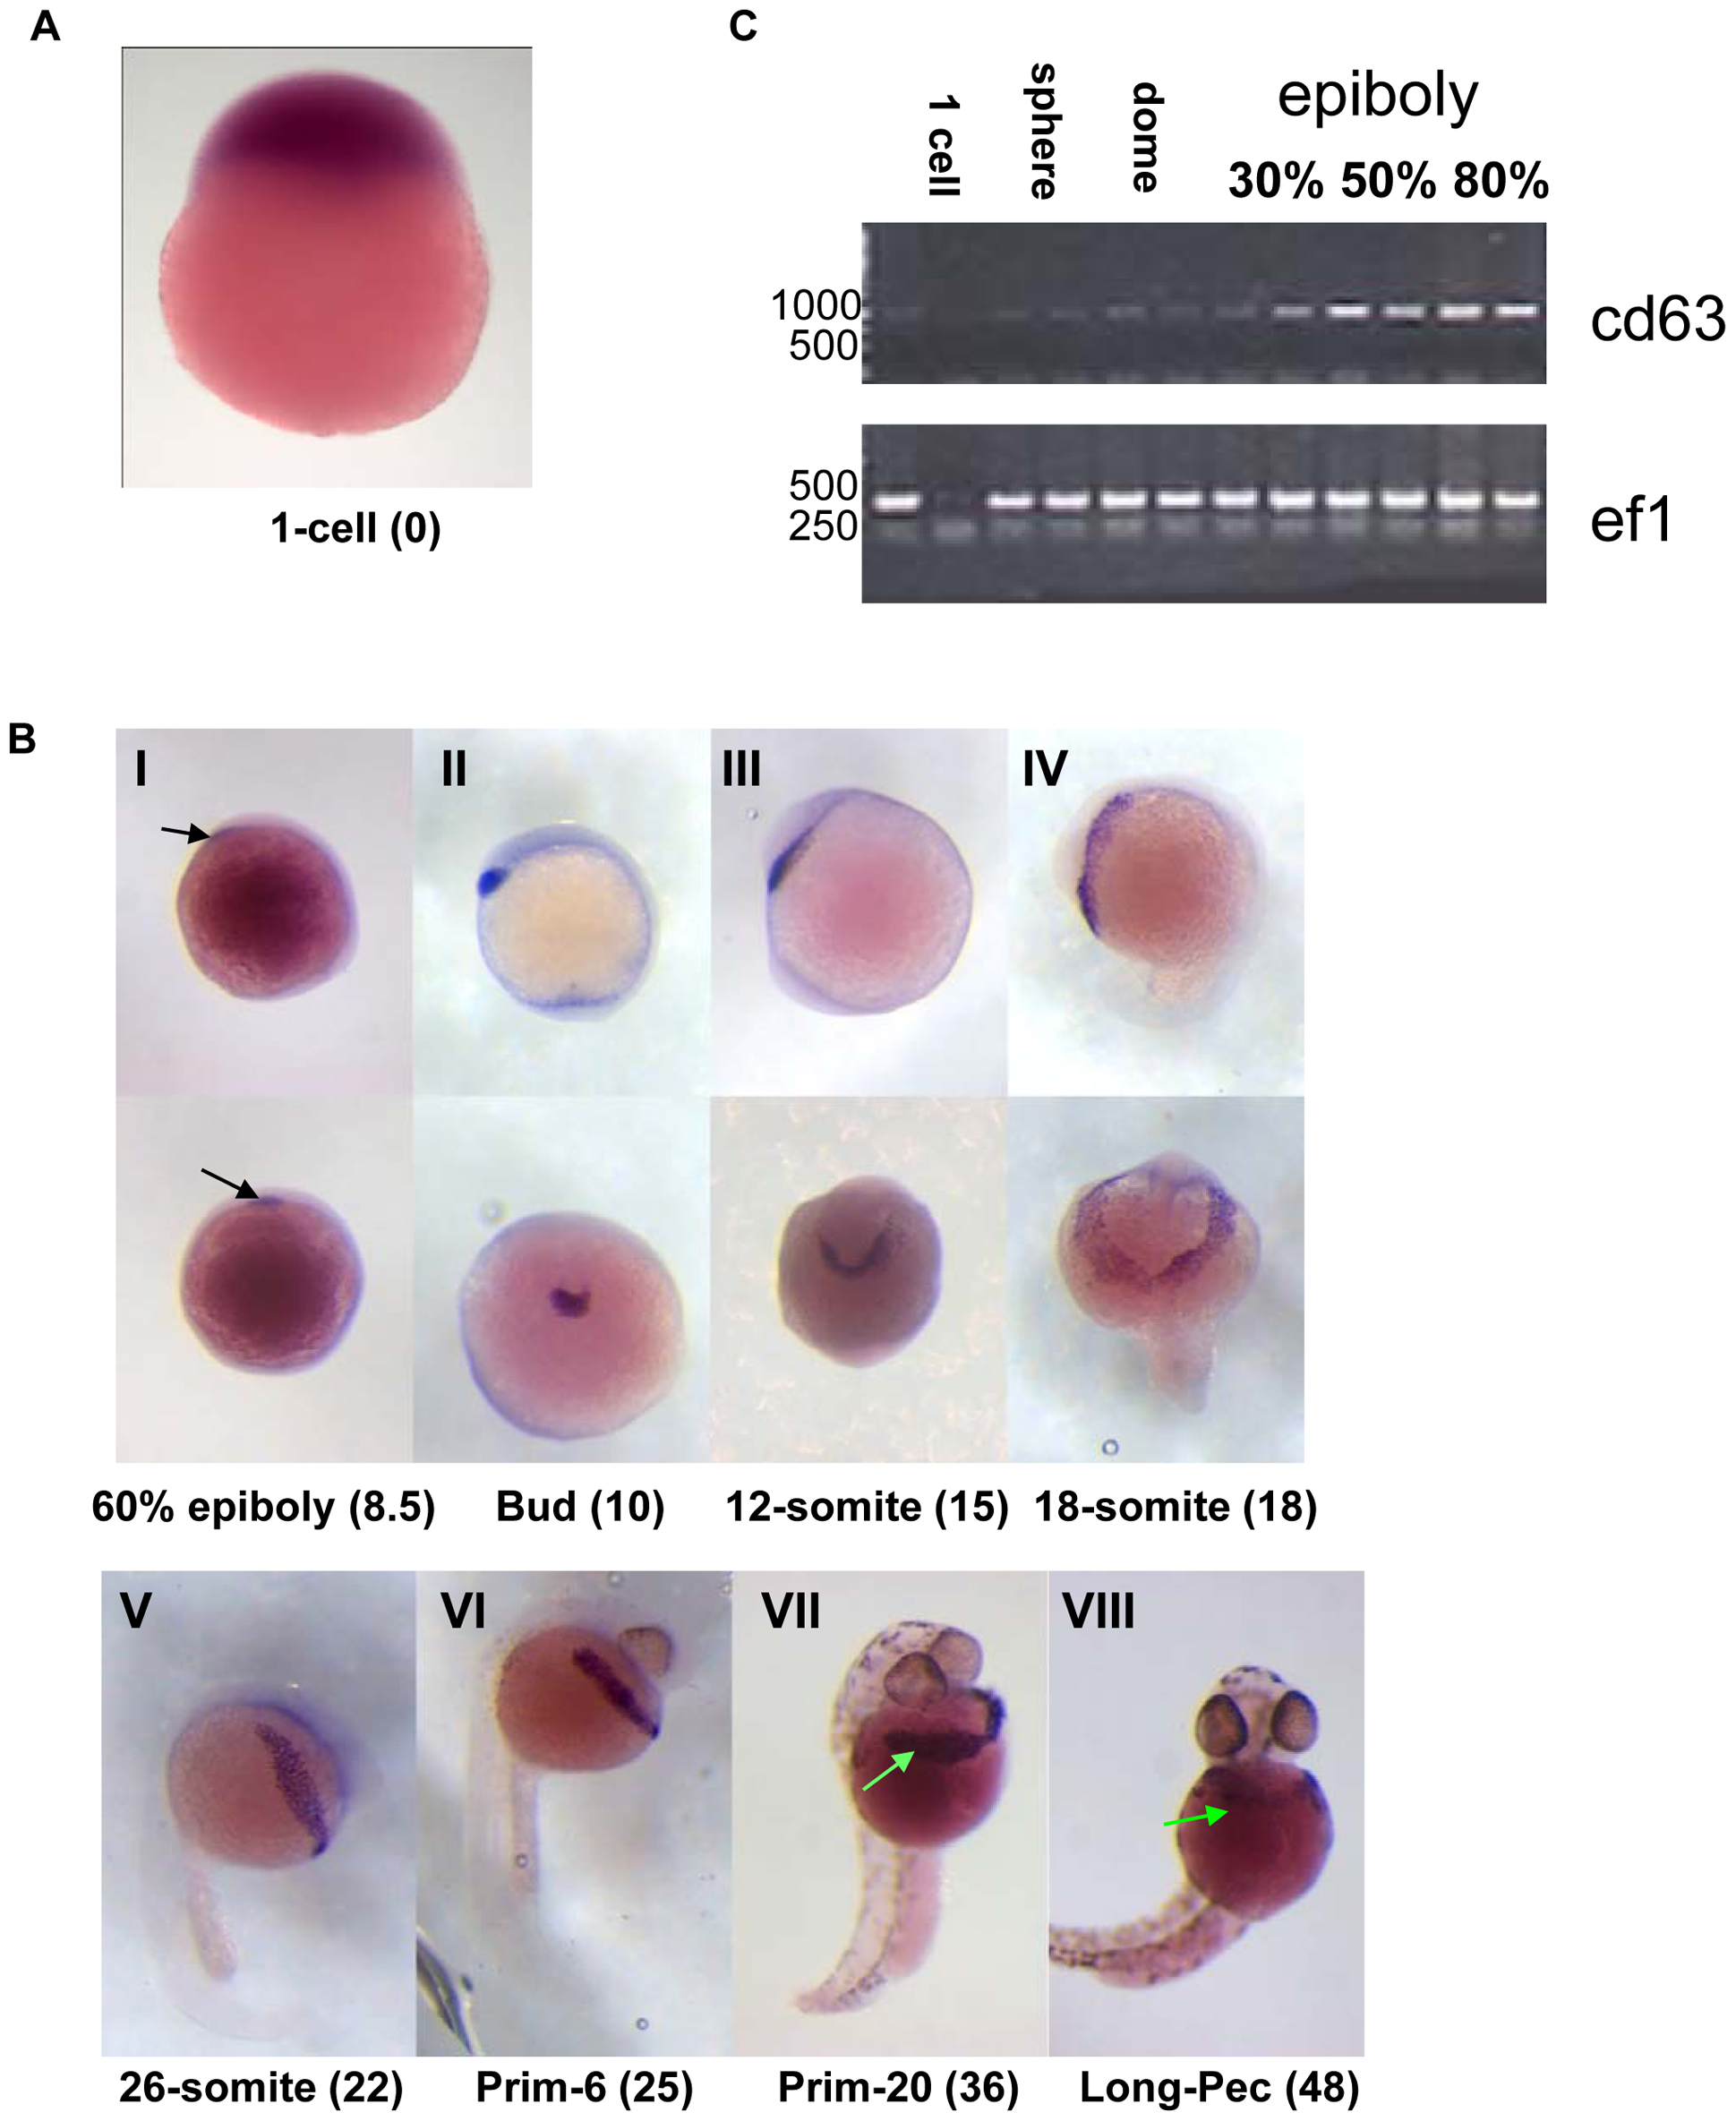
Fig. 2
cd63 transcript.
A & B. Location of cd63 transcript as revealed by ISH, using a probe against cd63. Developmental stages are noted below with hpf (hours post fertilisation) in brackets. In the top panel of B (I–IV), the top row gives the lateral view, bottom row ventral. In BI, arrows indicate the first expression in the pre-polster. cd63 expression continues (BII–VII). Expression in the hatching gland is indicated in BVII and BVIII, by arrows. C. RT-PCR time course using single embryos. PCR primers are indicated on the right, ef1 is a ubiquitous transcription factor used as a control. Numbers indicate ladder position in base pairs. Developmental stages are indicated at the top of the figure, each carried out in duplicate. This gel is representative of three replicates.