
Image
|
Figure Caption
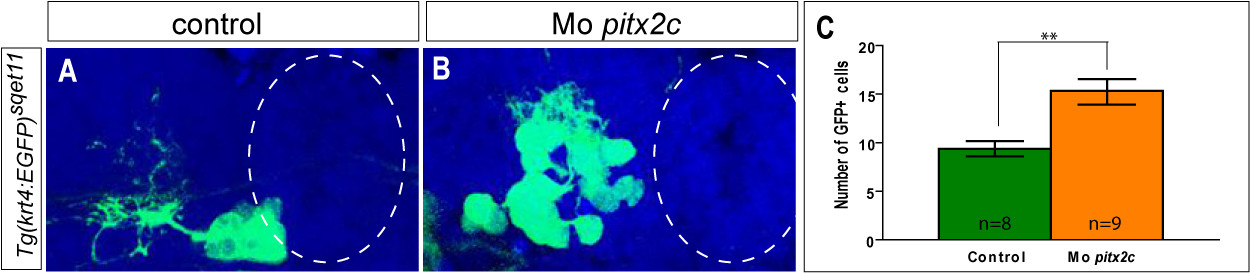
Fig. S3
(A,B) Confocal projections showing the expression of GFP from the Et(krt4:EGFP)sqet11 transgene in control and pitx2c morphant embryos at 72 hpf. The outline of the pineal gland is highlight with a dotted line.
(C) Counts of cell expressing GFP in control and pitx2c morphants. The number of GFP-positive cells is significantly increased in the morphant context; **P<0.01 using a t-test. Error bars represent s.d.
Acknowledgments
This image is the copyrighted work of the attributed author or publisher, and
ZFIN has permission only to display this image to its users.
Additional permissions should be obtained from the applicable author or publisher of the image.
Full text @ Development