
|
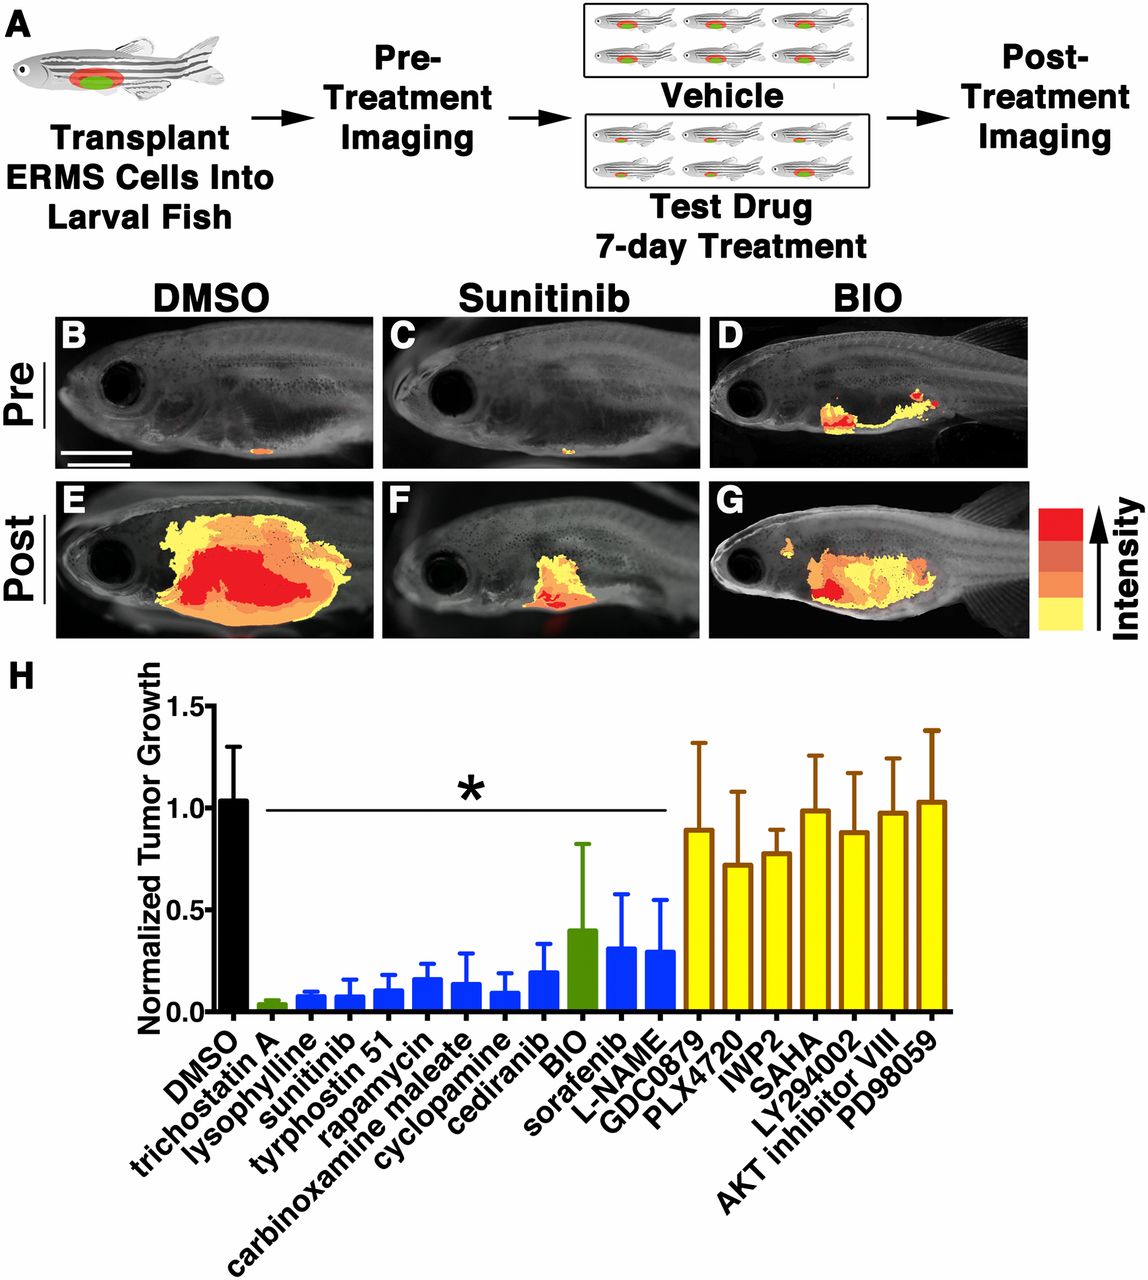
Fig. 2
A secondary screen identifies lead compounds that suppress ERMS tumor growth in live zebrafish. (A) Schematic of the secondary screen completed in zebrafish transplanted with fluorescent-labeled ERMS. (B–G) Pretreatment images for DMSO (B), sunitinib (C), and BIO (D), with corresponding posttreatment images (E, F, and G, respectively). Tumor volume is indicated by the heat map (Right). (Scale bar, 2 mm.) (H) Summary of tumor volume changes in animals treated with compounds that inhibit RAS-signaling in embryonic zebrafish (blue), representative compounds of major classes of hits identified in the human differentiation screen (yellow), or common hits from both screens (green). Error bars equal SD. *Statistical significance by Student t test, with P < 0.05.