
|
Fig. S19
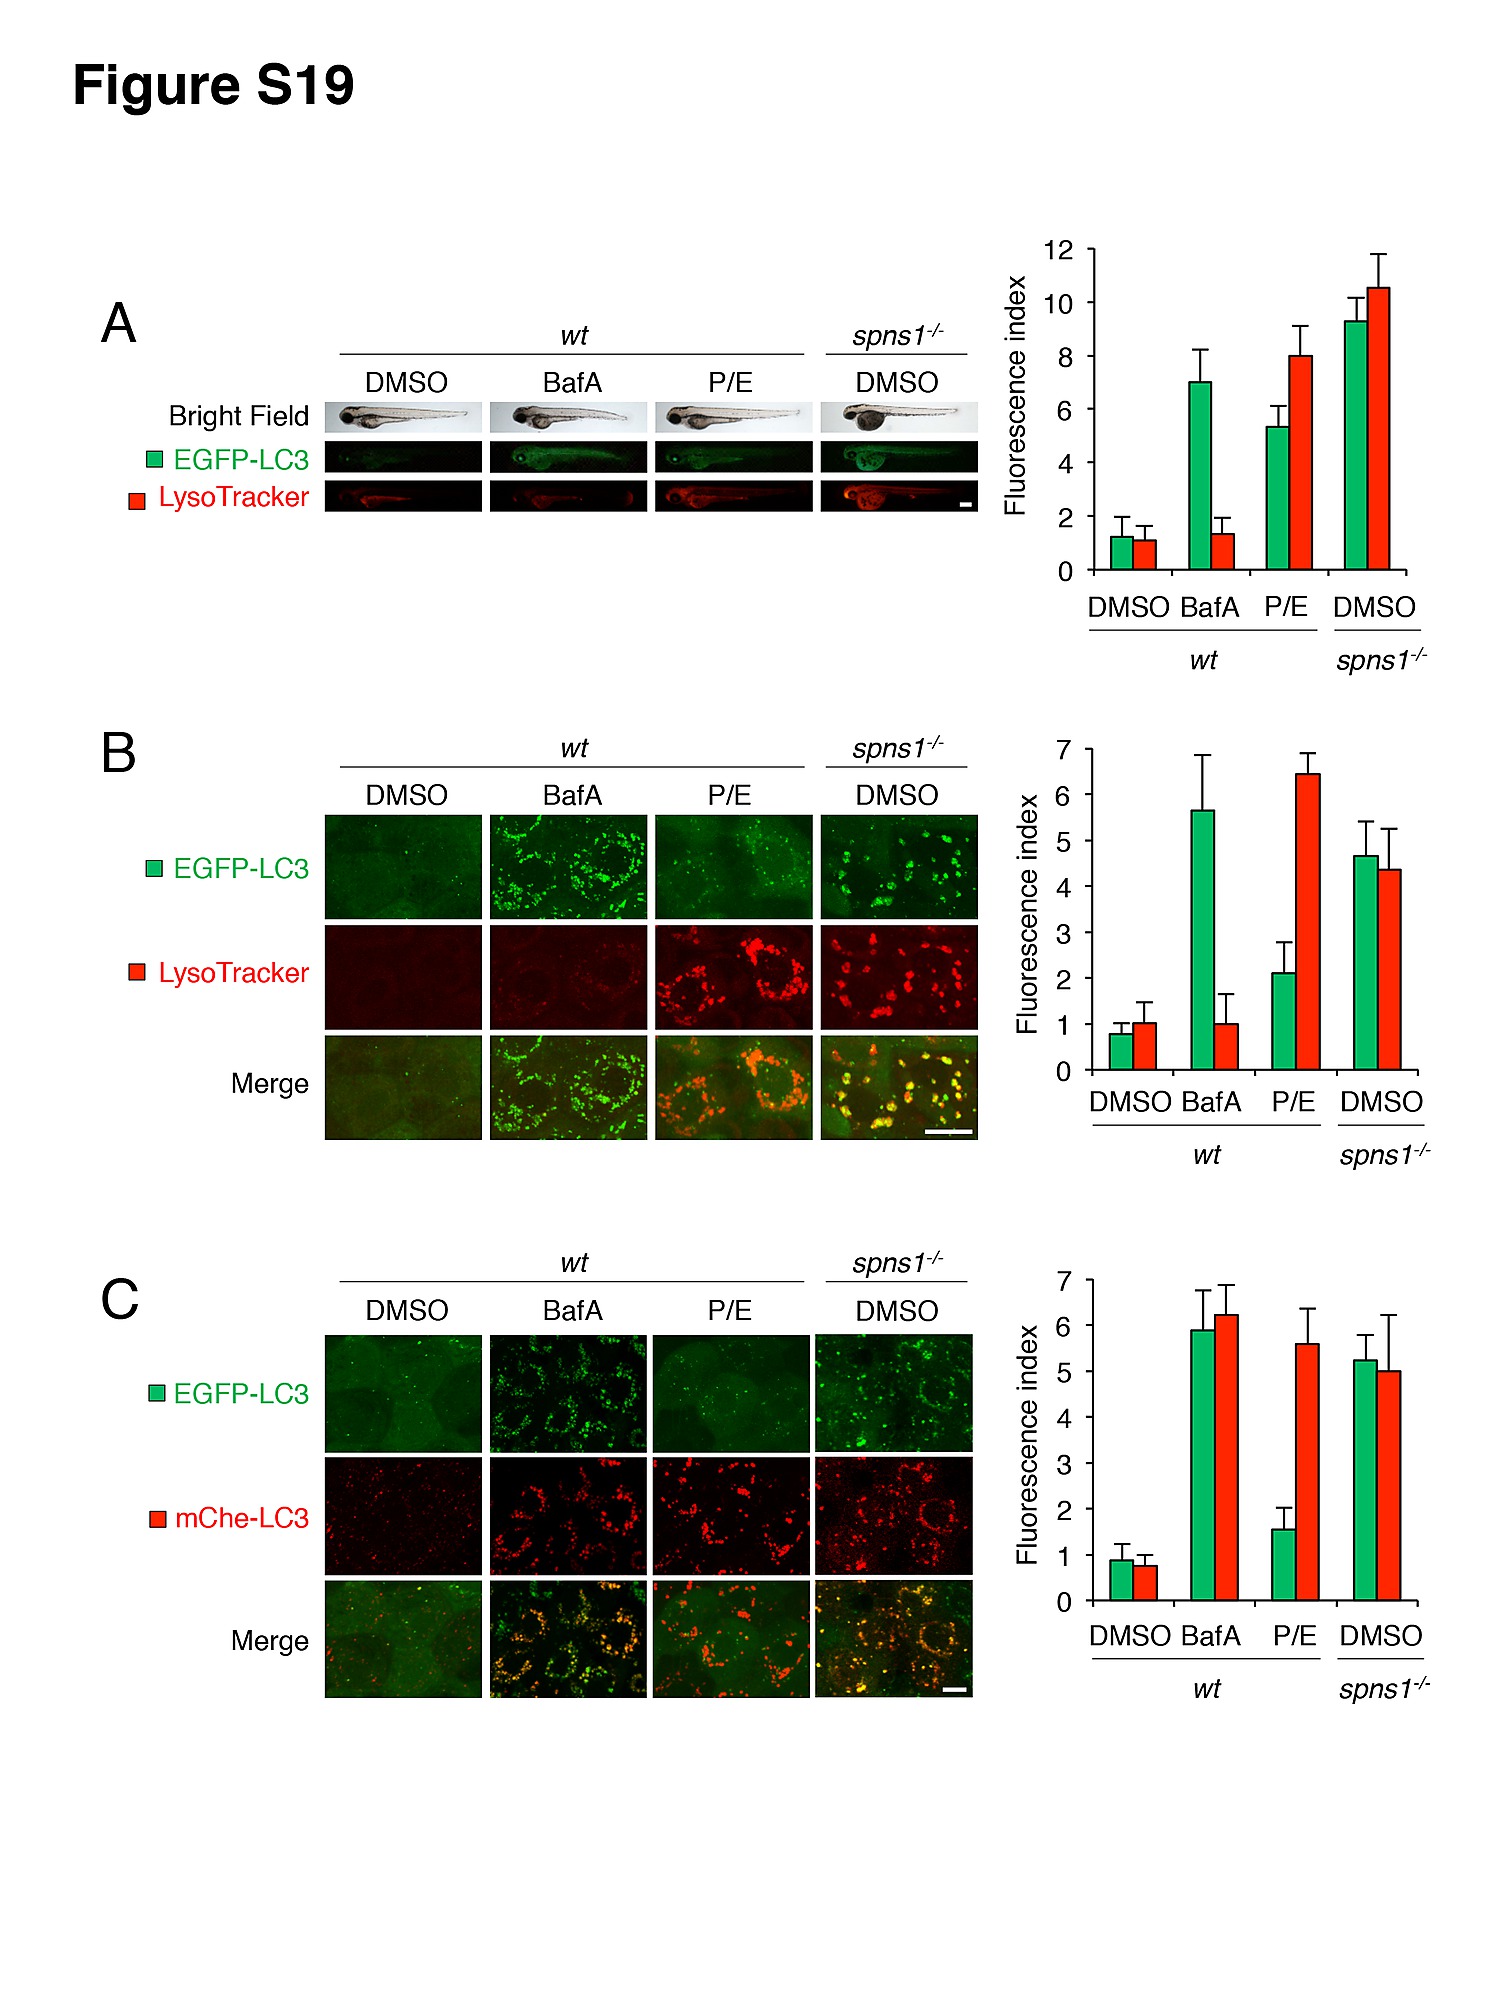
Validations of autolysosome formation and lysosomal biogenesis in zebrafish embryos. (A) Gross morphologies of BafA (100 nM)-treated or pepstatin A (5 μg/ml)- and E-64-d (5 μg/ml)-co-treated (P/E) wt [Tg(CMV:EGFP-LC3)] and spns1-mutant [Tg(CMV:EGFP-LC3); spns1hi891/hi891] animals. Embryos at 60 hpf were incubated with BafA or P/E for 12 h, and stained with LysoTracker at 72 hpf. Scale bar, 250 μm. Quantification of data presented in the middle and bottom rows (green; EGFP, red; mCherry) in panel A (n = 12) is shown; the number (n) of animals is for each genotype with DMSO, BafA or pepstatin A and E-64-d (P/E). (B) Intracellular autolysosome formation and lysosomal biogenesis in vehicle (DMSO)-treated, BafA (100 nM)-treated or pepstatin A (5 μg/ml)- and E-64-d (5 μg/ml)-treated (P/E) wt [Tg(CMV:EGFP-LC3)] and spns1-mutant [Tg(CMV:EGFP-LC3);spns1hi891/hi891] animals. Numerous large EGFP-LC3 puncta are evident in the BafA-treated embryos, with minimal LysoTracker staining. Some increased EGFP-LC3 speckles and strong enhancement of enlarged LysoTracker signals are evident in the cells from P/E-treated embryos. The same samples analyzed in (A) were observed by using confocal microscopy at a high magnification (×600). Scale bar, 10 μm. Quantification of data presented in the middle and bottom rows (green; EGFP, red; mCherry) in panel A (n = 6) is shown. The number (n) of animals is for each genotype with DMSO, BafA or pepstatin A and E-64-d (P/E). Three independent areas (periderm or basal epidermal cells above the eye) were selected from individual animals. (C) Impaired autolysosomal acidification in BafA-treated wt or in spns1-mutant embryos, but not in pepstatin A- and E-64-d-treated (P/E) wt embryos. EGFP-LC3 and mCherry-LC3 double-transgenic wt [Tg(CMV:EGFP-LC3:mCherry-LC3)] and spns1-mutant [Tg(CMV:EGFP-LC3:mCherry-LC3);spns1hi891/hi891] zebrafish were used to monitor autolysosome formation. Embryos at 60 hpf were incubated with BafA (100 nM) or P/E (5 μg/ml each) for 12 h, to be observed later at 72 hpf. Quenching of EGFP-LC3 signals but not mCherry-LC3 signals is seen in the P/E-treated embryos, whereas unquenched EGFP-LC3 signals are evident in the BafA-treated as well as the spns1 MO-injected embryos. Whole-mount samples were observed by using confocal microscopy at a high magnification (×600). Scale bar, 10 μm. Quantification of data presented in the middle and bottom rows (green; EGFP, red; mCherry) in panel A (n = 6) is shown; the number (n) of animals is for each genotype with DMSO, BafA or pepstatin A and E-64-d (P/E). Three independent areas (periderm or basal epidermal cells above the eye) were selected from individual animals.