
Image
|
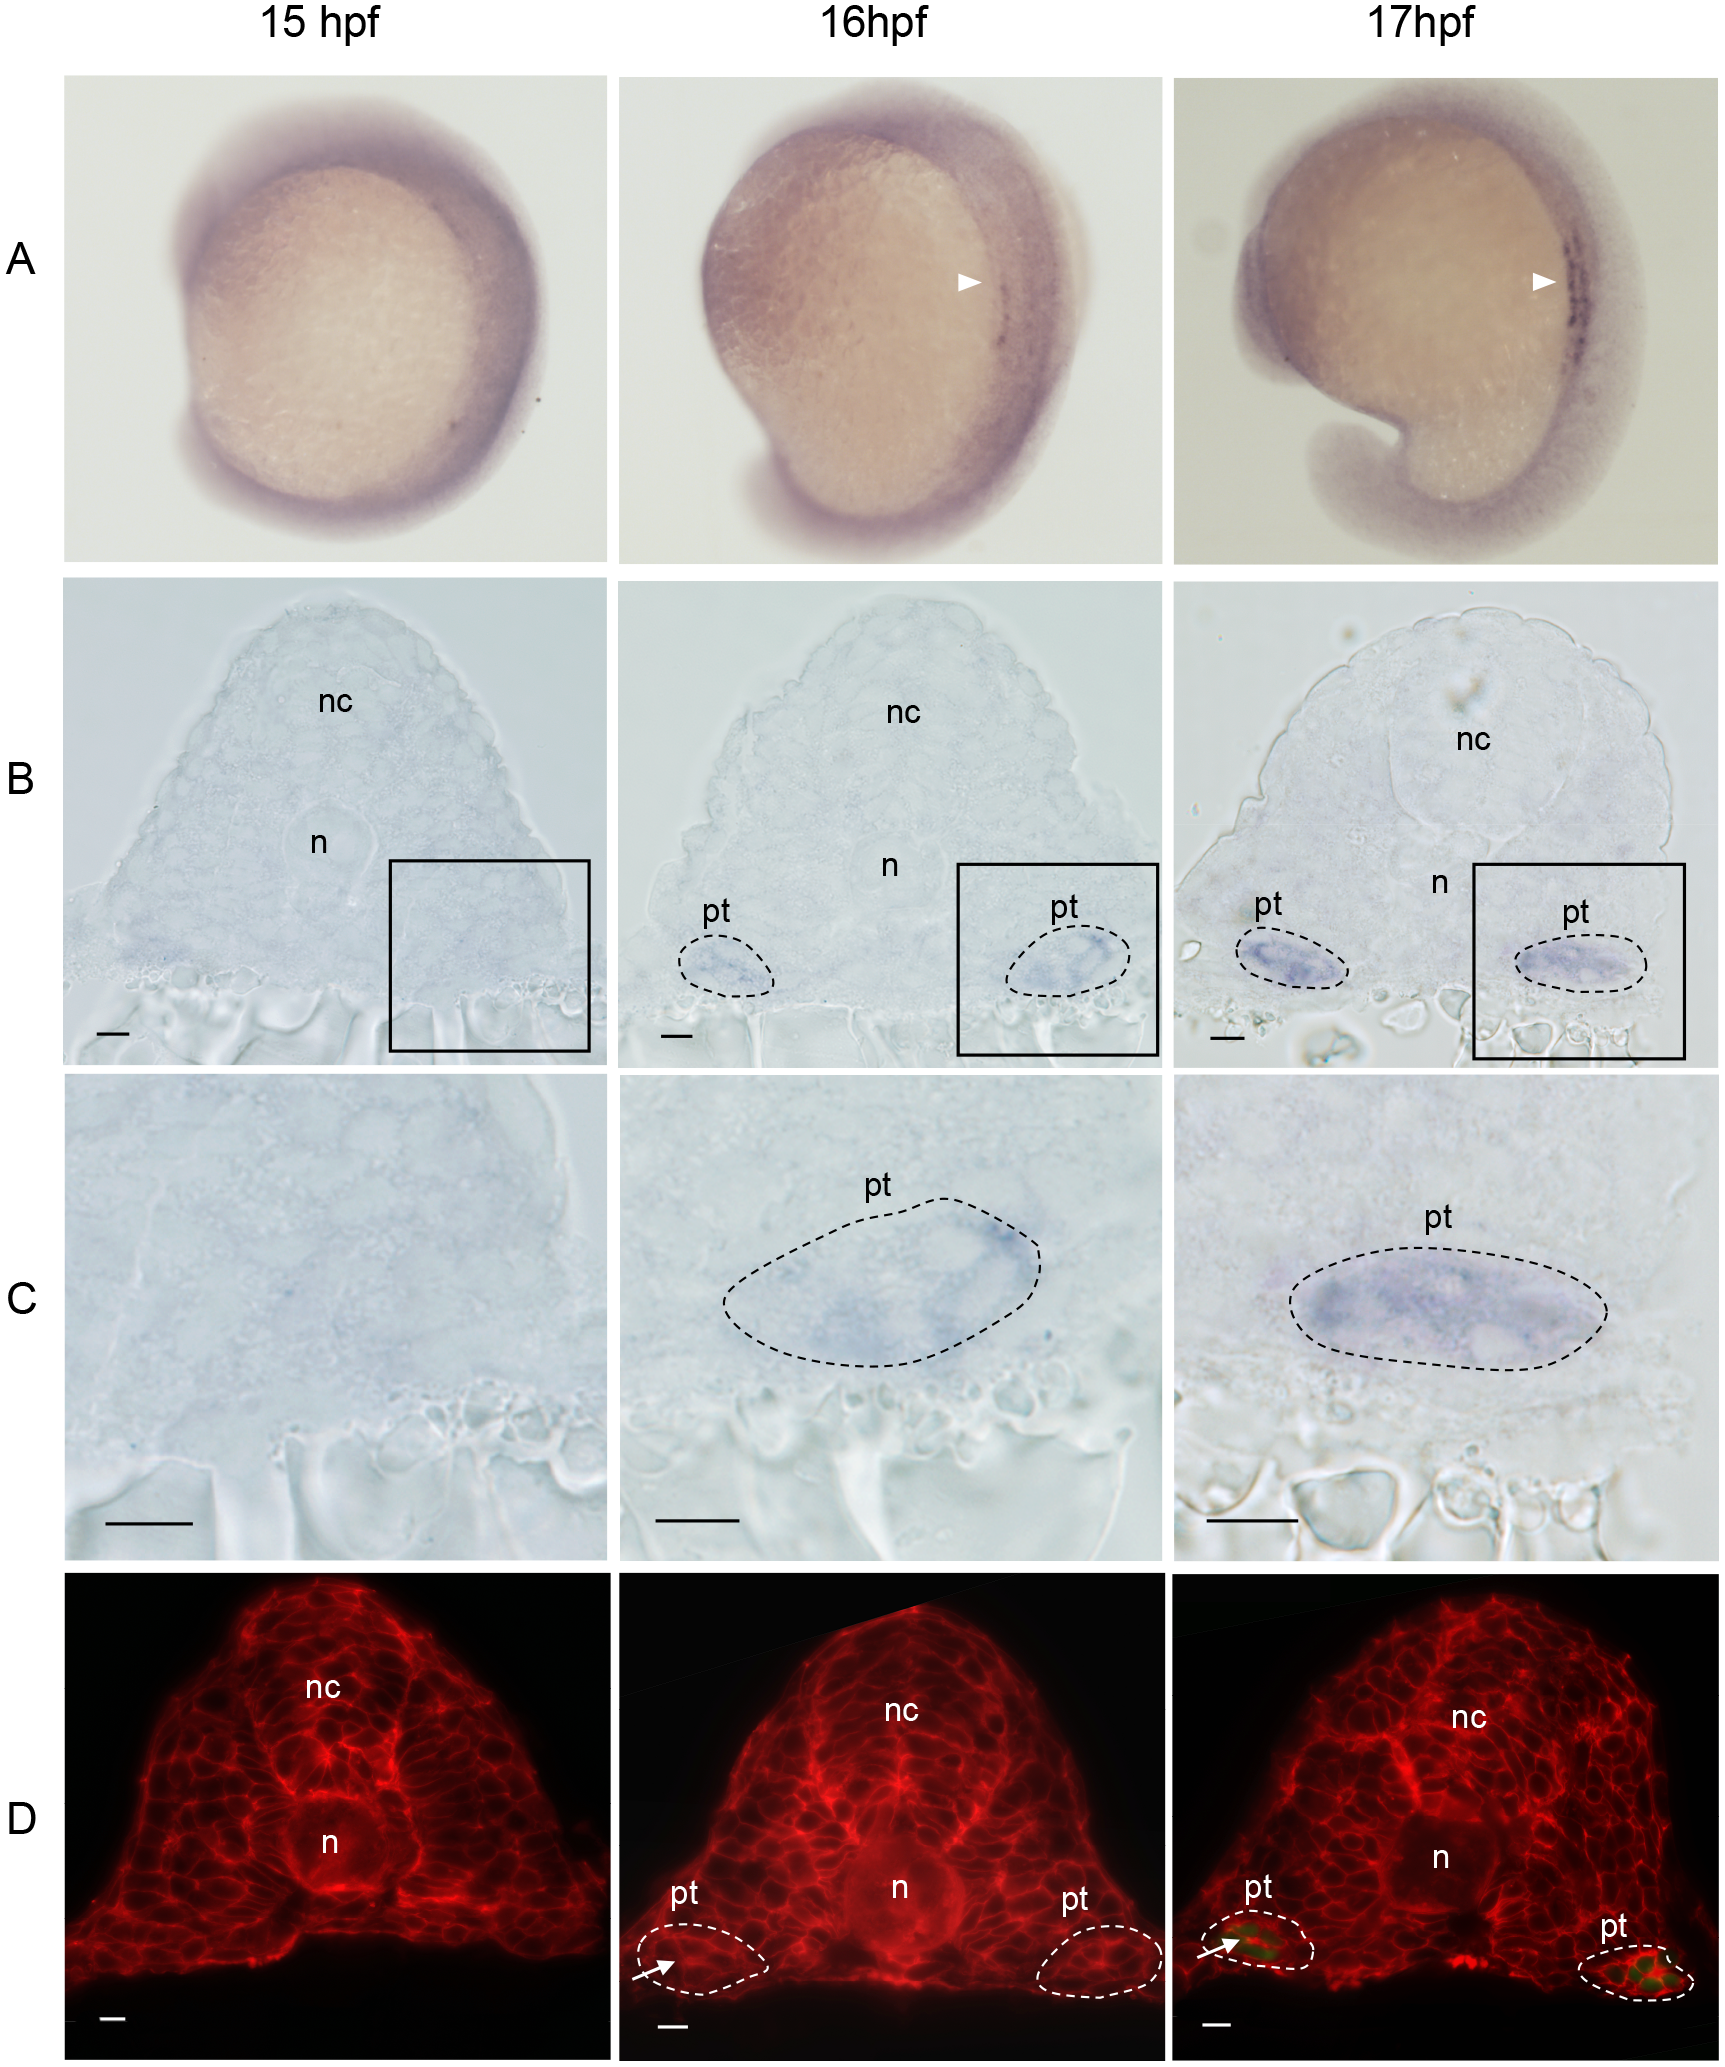
Figure Caption
Fig. 6
Onset expression of gfp mRNA during somitogenesis in Tg(gtshβ:GFP).
(A) WISH analysis of gfp (arrowheads) in 15, 16 and 17 hpf embryos, dorsal-lateral view. (B) Transverse sections of the embryos in A. (C) Higher magnification of boxed regions of B. (D) Cell boundary staining by the RFP-CVLS chimera protein on transverse sections of Tg(gtshβ:GFP) embryos. The gfp-positive cells are outlined by black dash lines. The tubular structures are outlined by white dash lines. Arrows indicate the lumen. nc: neural cord; n: notochord; pt: pronephric tubule. Bar = 10 μm.
Acknowledgments
This image is the copyrighted work of the attributed author or publisher, and
ZFIN has permission only to display this image to its users.
Additional permissions should be obtained from the applicable author or publisher of the image.
Full text @ PLoS One