
Image
|
Figure Caption
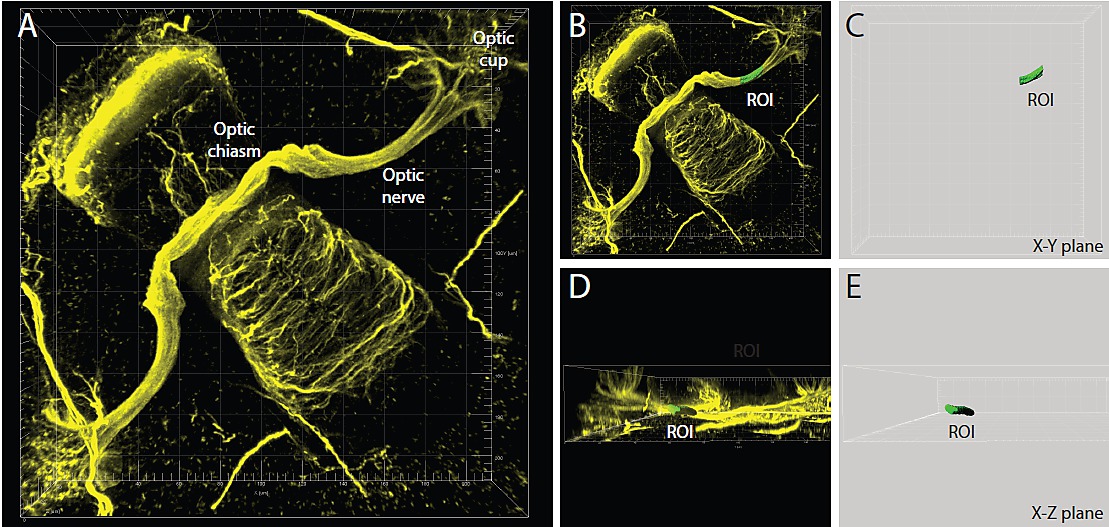
Fig. S3
Volumetric analysis of the optic nerve. Confocal image of a 2 dpf zebrafish head stained with antibody to acetylated tubulin to visualize axons. (A) Regions of Interest (ROIs) 7.5 μm×7.5 μm×15 μm in size along the optic nerve were selected from reconstructed 3-dimensional images using Imaris software [X–Y plane (B–C) and X–Z plane (D–E)]. Panels C and E show the reconstructed ROI from which volumetric measurements are calculated.
Figure Data
Acknowledgments
This image is the copyrighted work of the attributed author or publisher, and
ZFIN has permission only to display this image to its users.
Additional permissions should be obtained from the applicable author or publisher of the image.
Full text @ PLoS Genet.