
|
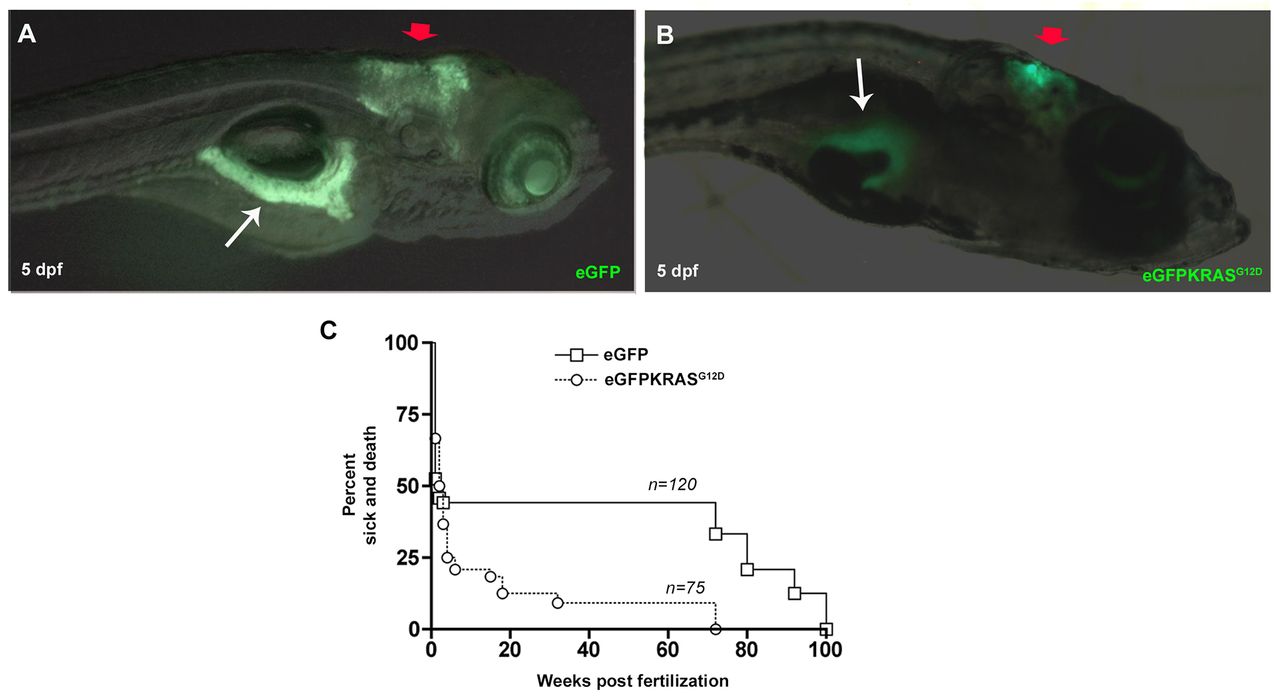
Fig. 1
Tissue specificity expression of eGFP and eGFP-KRASG12D under control of ptf1a promoter and Kaplan–Meier analysis. (A,B) Lateral views, anterior to the right showing that EGFP (A) and eGFP-KRASG12D (B) are specifically expressed in cerebellum (red arrows) and pancreas (white arrows) of larvae observed at 5 dpf. (C) Kaplan–Meier analysis of dead or severely sick animals revealed lethality for about 92% of Tg(ptf1a:Gal4)/UAS:eGFP-KRASG12D as measured at 24 wpf. Differences between Tg(ptf1a:eGFP) and Tg(ptf1a:Gal4)/UAS:eGFP-KRASG12D were statistically significant with P<0.05. Number of sample for each group are indicated.